
New Features: Network Interface Monitor and SMART Drive Monitor for Windows Servers
Written by Clifford
Today we launched an important product update that comprises two new types of monitors: the Network Interface monitor and the SMART Drive monitor. Let’s go through the major features and changes.
Please note that until the upcoming update the new monitors are available for Windows systems only.
Network Interface Monitor
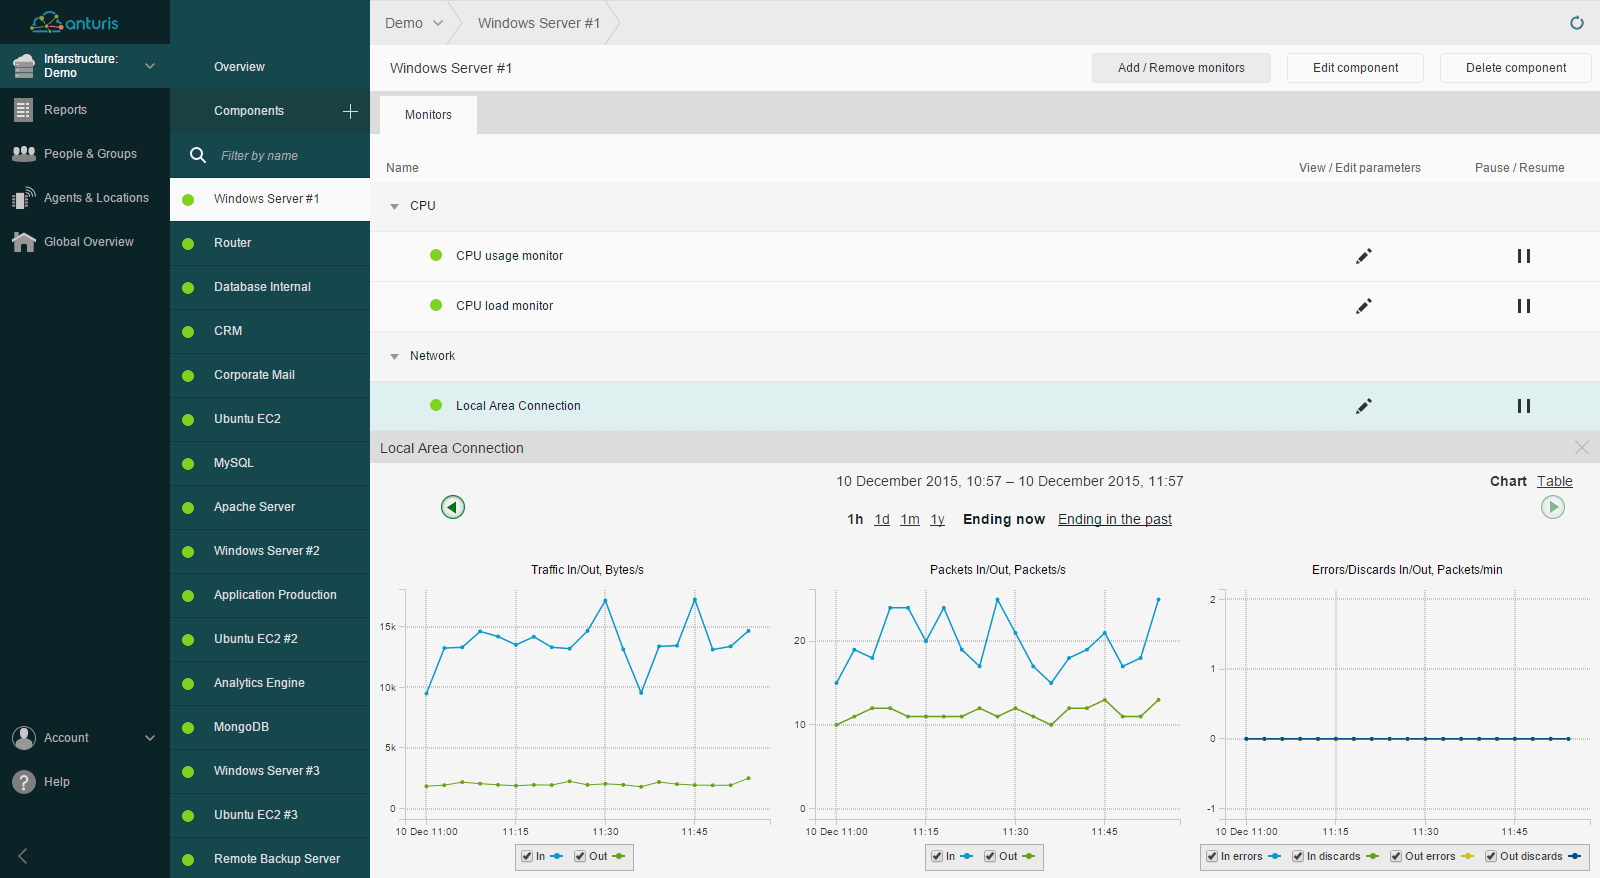
The new monitor (sometimes this monitor type is called “bandwidth monitor”) provides you with the capability to continuously record network activity data across network interfaces in order to analyze performance and traffic flow statistics and trends, and to be alerted if specified conditions are met. You can choose, from a predefined list, which adapter to monitor, so the setup will take less than a minute.
Four metric types are monitored, each including both incoming and outgoing data:
- Traffic (in/out) – amount of data (bytes per second) flowing through a network interface.
- Packets (in/out) – number of packets (packets per second) that go through an interface.
- Errors (in/out) – number of packets (packets per minute) that could not be transmitted or received due to the contained errors.
- Discards (in/out) – number of packets (packets per minute) dropped by an interface because of discard routes.
Setting up the monitor can be beneficial in many ways. For instance, you will be able to:
- Collect and analyze historical and real-time data on performance and traffic flow across network interfaces.
- Ensure an adequate amount of traffic is flowing through network interfaces.
- Detect problems on a particular network adapter.
- Troubleshoot quickly in case of high discard and error rates or abnormal data transmission and reception rates.
- Make smarter bandwidth allocation and hardware purchasing decisions based on the actual network activity data.
SMART Drive Monitor
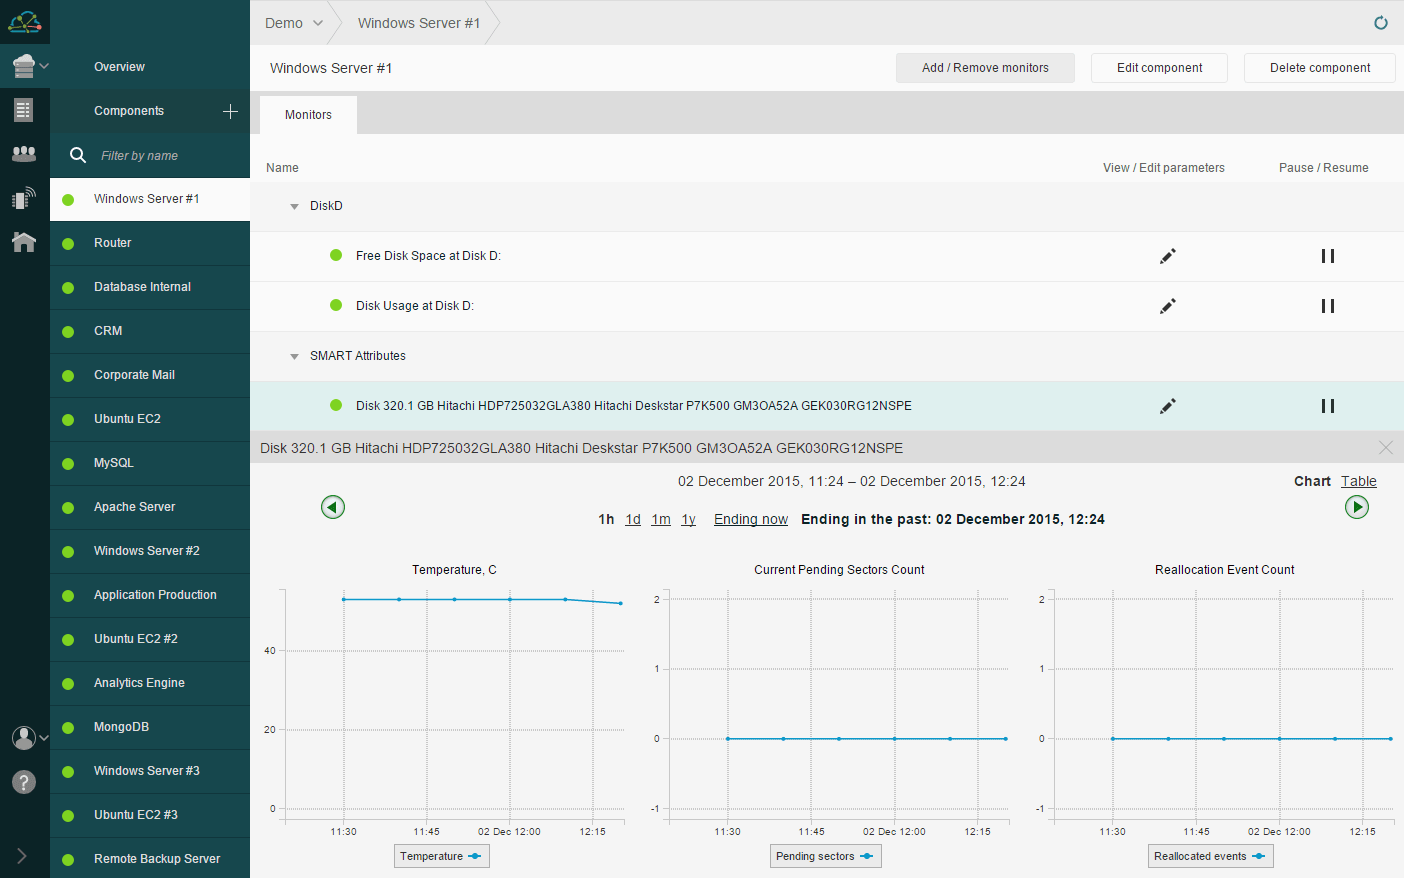
This monitor allows you to constantly check the SMART drive’s health status and performance attributes, analyze the collected historical data using reports, and be notified if a drive is about to fail or a chosen attribute’s value has exceeded the vendor-defined threshold. You can learn the basics of the SMART system here.
The following SMART attributes are currently available:
- Temperature
- Current Pending Sectors Count
- Reallocation Event Count
- Reallocated Sectors Count
- Spin Retry Count
- Soft Read Error Rate
- Disk Shift
- Remaining SSD Life
Benefits of the monitor:
- Faster troubleshooting in case of disk failures or performance problems.
- An eagle’s-eye view of the SMART attributes’ statistics and trends.
- Email, SMS, or call alerts in the event of an attribute’s status change that indicates a problem.
How to set up the new monitors
To configure the Network Interface and SMART Attributes monitors, please do the following:
- Update Windows Agent by downloading the latest version in the “Agents & Locations” tab.
- Create a new “Windows Server” component or open an existing “Windows Server” component in the new UI, click the “Add/Remove Monitors” button and then click the “Rebuild Component” button. The new monitor types will appear in the list.
- Turn on the needed monitors and set the thresholds.

Leave a Comment