
New Feature: Active Directory Monitoring
Written by Clifford
Since now you can setup Active Directory monitoring in up to five minutes by creating a new component in the Anturis UI. It allows you to monitor important AD performance indicators and replication status.
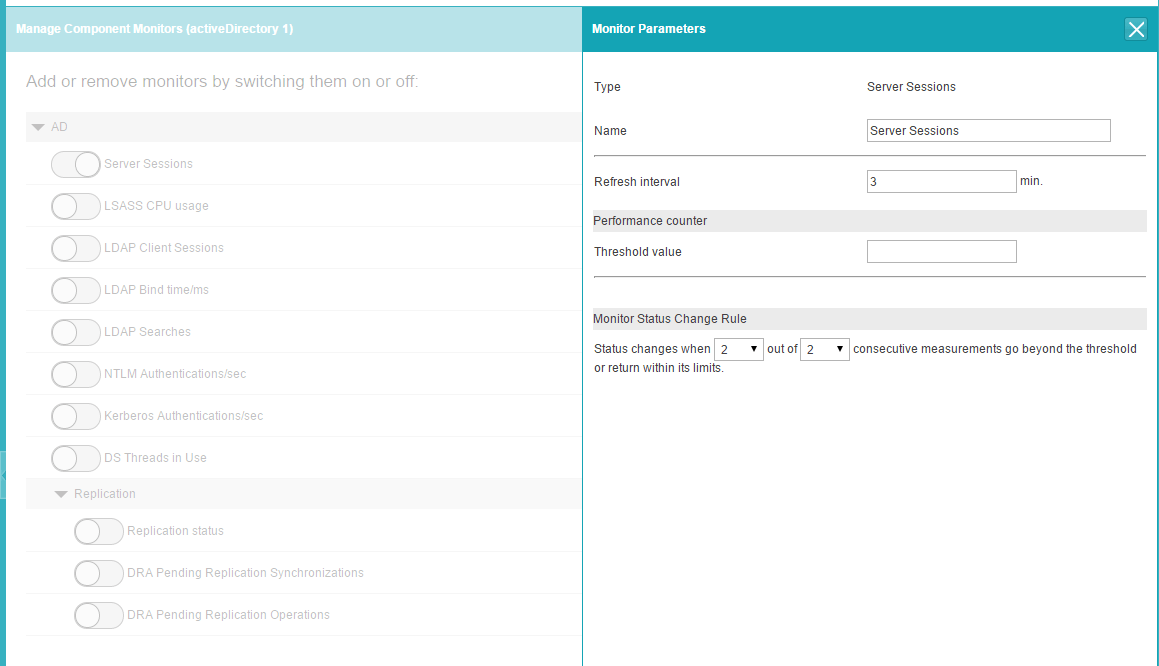
These are the metrics that are currently available:
- Server Sessions
- LSASS CPU usage
- LDAP Client Sessions
- LDAP Bind time/ms
- LDAP Searches
- NTLM Authentications/sec
- Kerberos Authentications/sec
- DS Threads in Use
- Replication status
- DRA Pending Replication Synchronizations
- DRA Pending Replication Operations
How to configure the AD monitoring
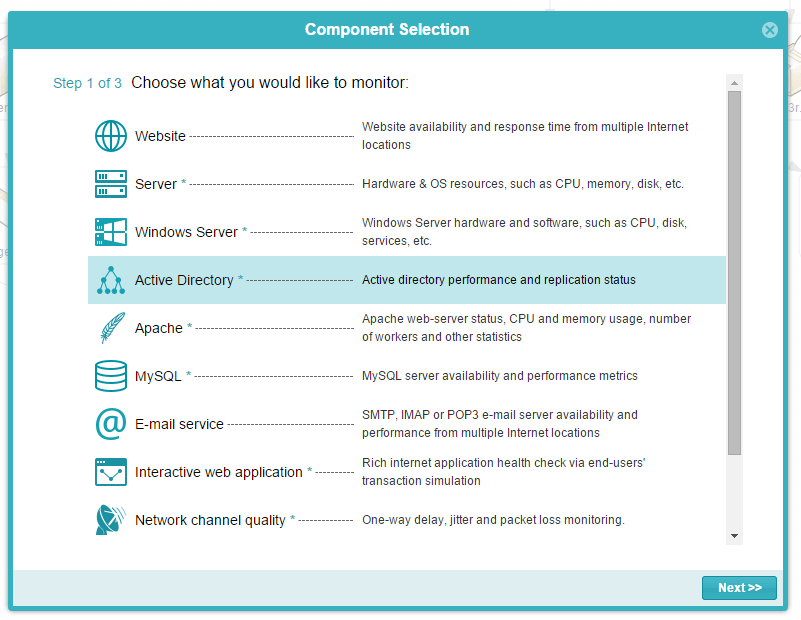
1. Click the ‘New Component’ button, choose the “Active Directory” component type in your UI, and choose the server where the AD is deployed.
2. Add the required monitors from the list and set the thresholds if needed.
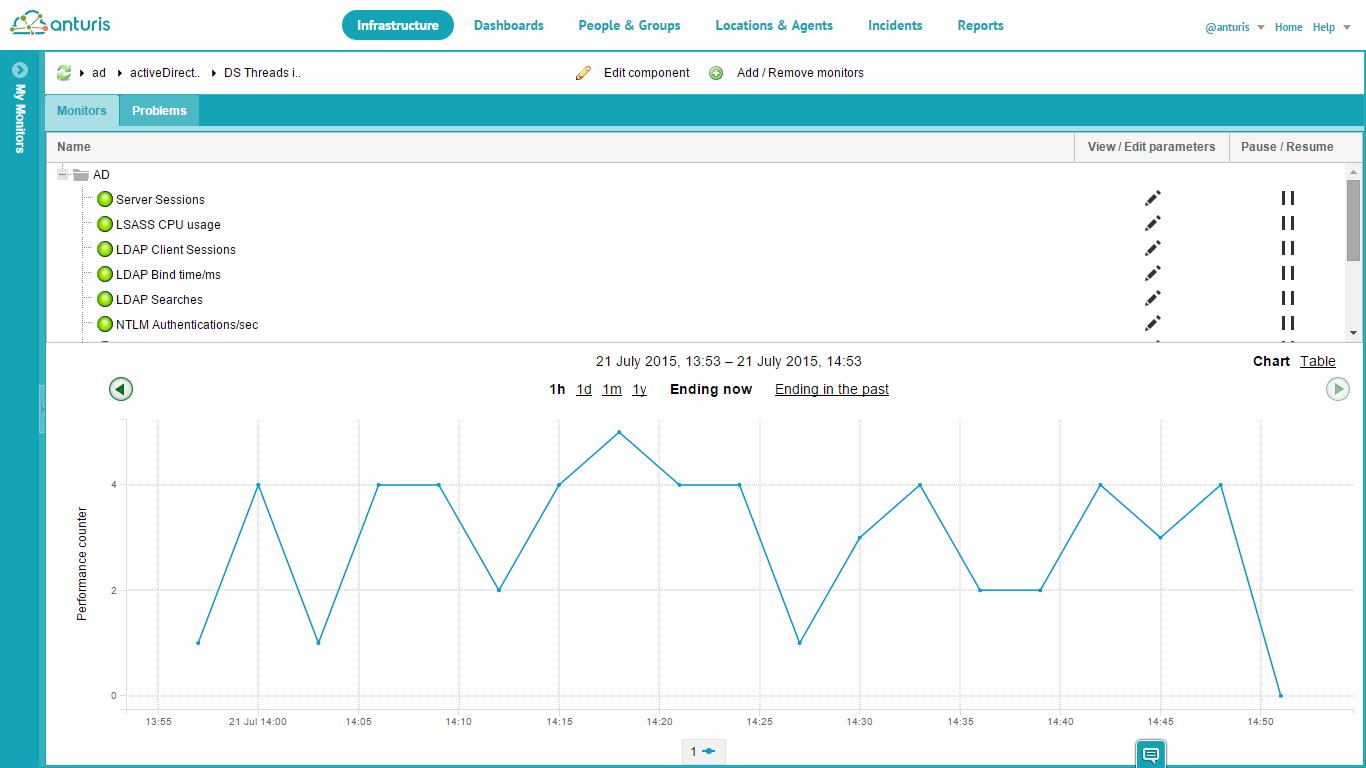
3. That’s it! You can always add/remove the monitors and edit the parameters if required.
If you have any questions or suggestions, please use the comments section below or write to us at [email protected].

Leave a Comment