
We launched Anturis 2.0 – with Java Application Monitoring and Parallels Plesk Uptime Monitor
Written by Clifford
Today we released Anturis 2.0. The new version of our IT monitoring and troubleshooting service delivers Java Virtual Machine (JVM) monitoring and Parallels Plesk Uptime monitoring capabilities.
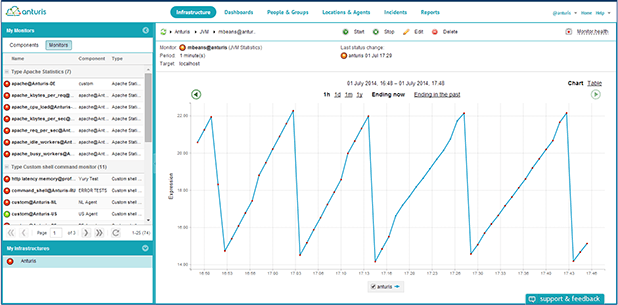
The JVM is the code execution component of the Java platform. Java was designed to allow programs to be built once and then to run on any platform. JVM makes this possible by interpreting Java binary code for various hardware platforms, so that they can perform a Java program’s instructions. However, Enterprise Java Applications are complex and the JVM hides its memory handling details. Improper clean-up of JVM memory can cause the application to run slow. As a result, application administrators need to ensure optimal JVM configuration and to monitor JVM memory and performance.
To simplify this complex process, Anturis JVM Monitoring allows users to monitor total memory usage, heap, non-heap and pool memory usages, as well as threads and classes of JVMs, to ensure optimum performance. With Anturis’ JVM monitoring, you can monitor all your Java applications in one web console. You can also set up warning and error thresholds for every parameter of each Java application running in the JVM. Anturis provides alerts and notifications to enable system administrators to take corrective actions and improve Java Application performance.
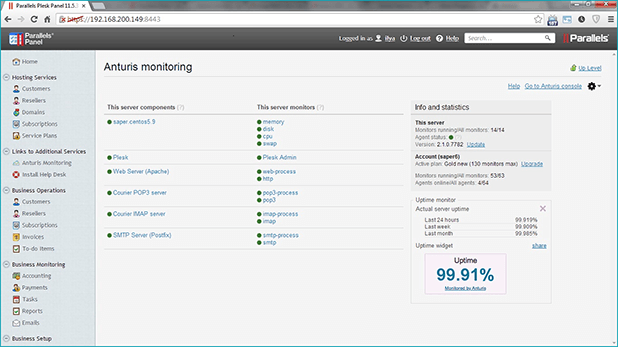
Anturis Version 2.0 also includes Parallels Plesk Uptime Monitor, a new feature of Anturis Parallels Plesk plugin. This new Plesk Uptime Monitor periodically checks whether servers are reachable and functioning properly. You can start basic monitoring of your servers in the Parallels Plesk Panel – even if you don’t have an Anturis account.
If you need more advanced monitoring features (including transactions monitoring, email, SMS or voice call alerts, reports, detailed graphs, dashboards, etc.), it is easy to create an Anturis account through the Plesk Panel. You can share server uptime statuses on your websites via the new Anturis Uptime widget, which shows website uptime percentage. This widget is a great way to show your customers that your web service is reliable.
About a year ago we launched the first commercial version of our service. Since then we’ve made many product upgrades and enhancements, including cPanel/WHM and Parallels Plesk integration, Apache monitoring, new informative dashboards, Anturis Mobile application, printer monitoring, improved interface and other additional features. The new Anturis 2.0 with JVM monitoring and Parallels Plesk Uptime is the latest major step forward for us and our customers.
We are not going to stop there in improving our product. That’s why we need your feedback. Please send all your comments, bug reports and feature requests to [email protected]. Thank you.

Leave a Comment