Anturis 2.5 Features Multiple Infrastructures and the Final Version of the New cPanel Plugin
Written by Clifford
We’ve launched Anturis 2.5 – a new version of our monitoring service. The new version introduces three new features: multiple infrastructures; a new monitoring location in Brazil; and the final (RTW) version of the new cPanel &WHM plugin. It also provides improved ssl support for Anturis agent and a couple of minor bug fixes.
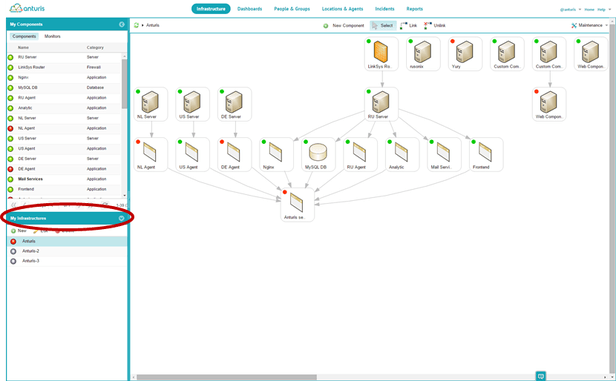
The new ‘multiple infrastructures’ function enables you to create separate infrastructures. So you can have different infrastructure maps for different tasks, departments, offices, or clients. To create a new infrastructure map, click the ‘New’ item in the ‘My Infrastructures’ section on the left hand side toolbar, then define the new infrastructure name, press ‘Add’, and a page for new infrastructure page will be created. Now you can add components and monitors to each infrastructure independently. You can edit or delete each infrastructure as needed.
The new monitoring location in São Paulo will allow users from Brazil and other Latin American countries to gather more precise data about their website downtime, response time, etc.
Anturis 2.5 also includes the final (RTW) version of the new improved Anturis’ plugin for cPanel & WHM. The new cPanel Uptime Monitor periodically checks if servers are reachable and functioning properly. Users can start basic monitoring of servers in cPanel & WHM − even if they don’t have an Anturis account. For more advanced monitoring features (such as transactions monitoring, email, SMS or voice call alerts, reports, detailed graphs, dashboards, and so on), you can create an Anturis account easily through the cPanel interface. Anturis’ new Uptime widget shows website uptime percentage. You can place the widget on your website to show your customers that your service is reliable. The plugin can be installed in just minutes. You can download the plugin here.


Leave a Comment