
We launched Anturis 1.4 – with Parallels Plesk Integration, Dashboards Functionality and Other Useful Features
Written by Clifford
Anturis Version 1.4 delivers enterprise-grade IT infrastructure monitoring and troubleshooting in a simple, affordable and easy-to-setup and use cloud solution. Anturis is specifically tailored to meet the needs of SMBs that do not have advanced IT departments or a large IT budget. Today’s IT infrastructure monitoring market predominantly offers solutions that are either enterprise grade, comprehensive and prohibitively expensive, or open source and DIY. Unlike other solutions, Anturis stands alone by providing a complete IT infrastructure monitoring and troubleshooting service that includes all the features an SMB company needs — but is also affordable and simple to set up and use.
“2013 was a remarkable year for Anturis. We brought our beta IT monitoring solution to commercial launch, closed our venture funding and continued to improve our products to ensure we offer our users the best solutions in the market,” said Sergey Nevstruev, Anturis CEO. “As simple as creating or logging in to their account, Anturis Version 1.4 with Parallels Plesk integration, now only takes minutes to set up and start monitoring all of a customer’s servers and software. It’s that simple. With Version 1.4, web hosters and website administrators who are using Parallels Plesk are now able to benefit from the simplicity of our cloud-based solution.”
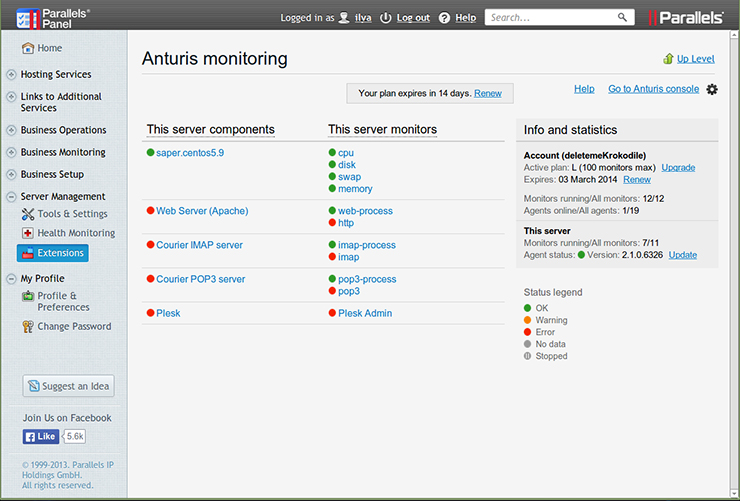
In its aggressive efforts to provide top-tier IT monitoring capabilities for web hosting providers and website owners, Anturis is continuously working to improve and build upon its successful solutions. The Anturis Version 1.4 launch follows Anturis’ recent successful integration with cPanel & WHM. With its new Parallels Plesk plugin, Anturis now supports both of the most popular control panels for server and web stack administration. This integration makes it incredibly easy to set up monitoring for Plesk Panel users, as the special Anturis plugin can fetch both server and typical software configurations and set up monitoring of these elements automatically.
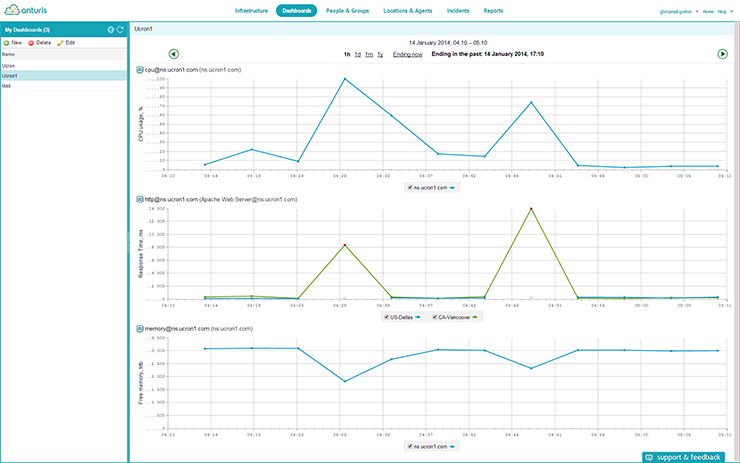
Also new to Anturis Version 1.4 is its Dashboards feature. Anturis Dashboards offer a useful and expansive view of a system’s operating metrics, and is a crucial tool for troubleshooting complex issues. Anturis Dashboards allow users to easily see and compare the graphs of all system resources and applications, as well as graphs of external Web monitors. With Dashboards, users are able to easily zoom into a problem, visually check abnormal behavior and spot correlations between different metrics.
Anturis Version 1.4 offers further new product features, optimizing IT monitoring functionality, including:
- More responsive and faster graphs
- Re-worked graph UI with more convenient access to single checks data
- Optimized back-end performance
- Optimized fail detection algorithm with improved false alerts filtering
To view a demonstration of the new Anturis Parallels Plesk integration firsthand, please visit: anturis.com/plesk.

Leave a Comment