Network monitoring with Anturis
Written by Clifford
Monitor network availability and performance with easy-to-use, cloud-based monitoring software
Anturis network monitoring software (SaaS) provides you with capabilities to:
- Quickly identify network performance and availability problems for proactive troubleshooting.
- Receive customizable alerts based on incident severity, component dependencies, thresholds, team roles or responsibilities.
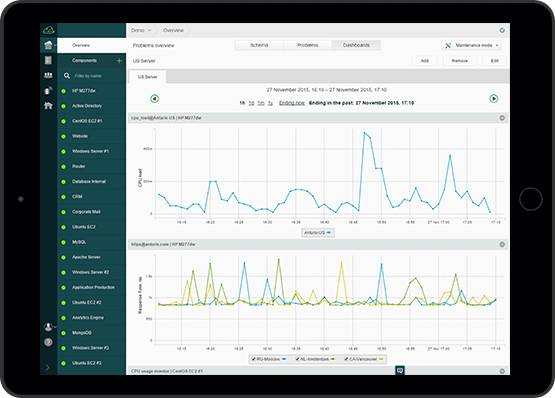
- Analyze network errors and historical and real-time performance statistics and trends.
- Experience quick and straightforward wizard-driven setup on both Linux and Windows machines, as well as easy monitoring configuration.
Cloud-based network monitoring software (SaaS) advantages
- Seamless setup – network monitoring setup on Linux and Windows takes only a matter of minutes.
- Low maintenance complexity and costs – no need for the allocation of extra hardware resources or additional software to install and maintain.
- Scalability – easily add as much infrastructure and as many components as you require, and streamline them for different tasks, departments, offices, or clients.
- Web-based UI – the monitoring application is available from any computer or tablet device anywhere around the world.
An essential monitoring collection for networks and servers
- Network devices monitoring: Ping, SNMP devices, printers.
- Network channel quality monitoring: packet loss, jitter, latency (one-way delay).
- Network interfaces monitoring: traffic, packets, errors, discards.
- A wide range of network protocols: ICMP, HTTP, TCP, SSH, FTP, SMTP, IMAP, POP3.
- Server monitoring: CPU usage, CPU load, RAM, free disk space, disk usage.
- Software monitoring: MySQL database, Apache server, log files, custom scripts, swap usage, OS processes, Windows services, Active Directory, JVM, Windows Event Logs.

Agent-based and agent-less monitoring
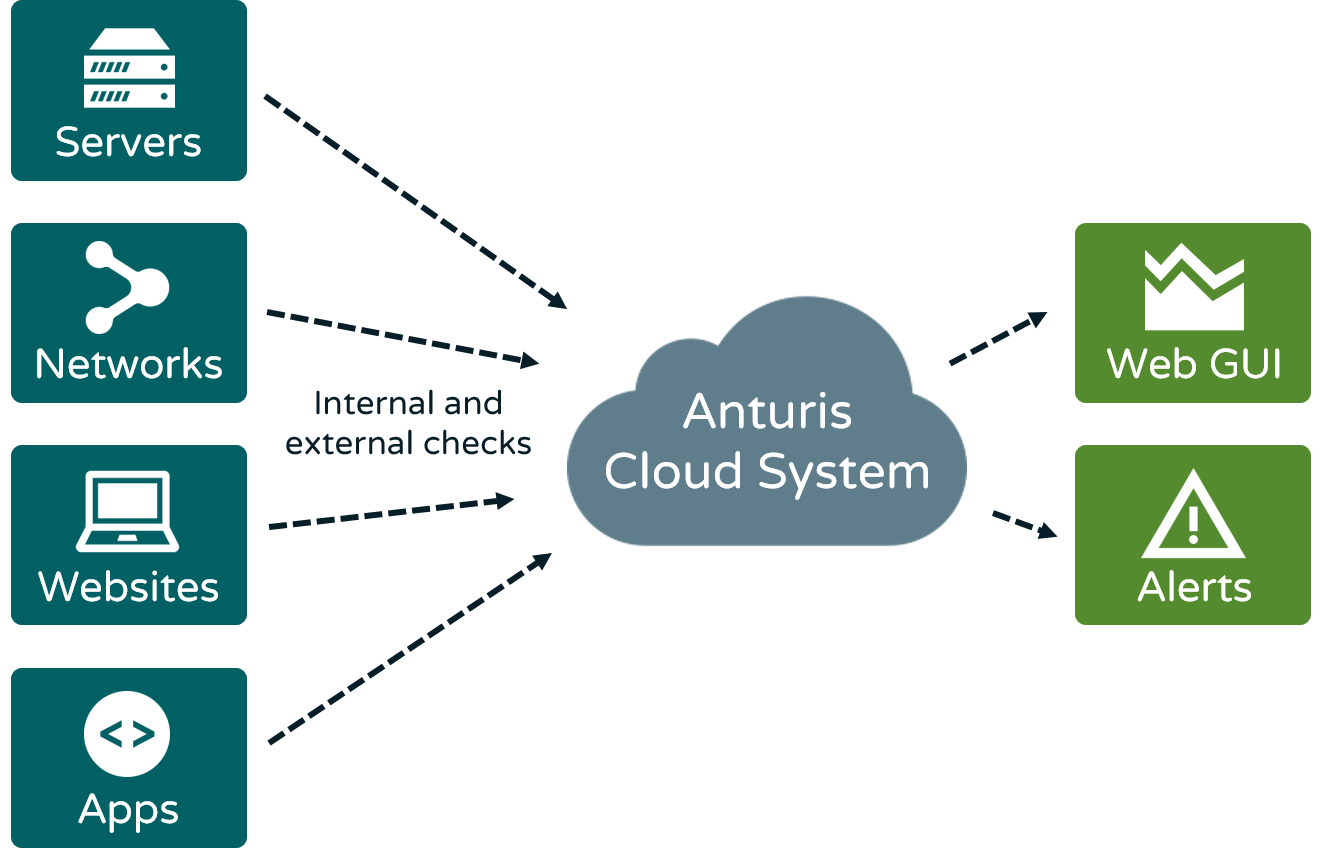
Anturis is a network-monitoring tool for both external (via the Anturis worldwide polling network) and internal (behind the firewall) checks within local area network (LAN) or wide area network (WAN).
Using the external checks you’ll instantly know if your internet-facing devices are experiencing connectivity issues. Anturis maintains a global monitoring network, which constantly checks that your servers and web services are up and running – and reachable for internet users.
For internal monitoring small-footprint native agents are installed on the local servers to monitor the network routes and devices. The agent maintains a secure connection with Anturis’ ISO 27001-compliant datacenter. Because the agent uses an HTTP client-side connection, no firewall configuration changes are required. The collected data can be then securely accessed from anywhere via the Anturis web console.
Infrastructure schema view with impact-dependencies modeling
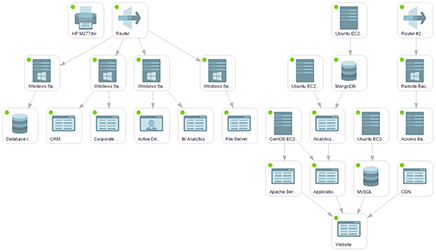
You can set up an infrastructure schema view by creating meaningful and logical dependencies between network components, such as routers, printers, switches, UPSes, storages, servers, and applications.
Using impact dependencies, Anturis network monitoring tool is able to track down infrastructure components that may be causing a problem and also assess the problem’s impact on other infrastructure components. This provides the most complete picture of a problem’s cause and effect and, by helping to correctly gauge the severity of the problem, it allows for more accurate alerting of the appropriate responsible party.
Email, SMS, and voice call notifications
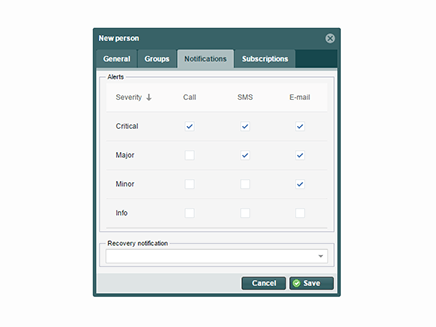
Minute by minute, Anturis’ back-end servers verify that everything is OK with your network and network devices. In case of a problem, an alert is sent to the designated person in charge. Various means of alert-notification can be activated, depending on the problem priority: e-mail, SMS or voice call.
Alerting can be configured according to:
- Problem/incident severity.
- Components dependencies.
- Monitor status-change rules.
- Warning and error thresholds.
- Team members’ responsibilities.
Monitor network availability and performance with easy-to-use, cloud-based monitoring software. Anturis network monitoring software (SaaS) provides you with capabilities to:
- Quickly identify network performance and availability problems for proactive troubleshooting.
- Receive customizable alerts based on incident severity, component dependencies, thresholds, team roles or responsibilities.
- Analyze network errors and historical and real-time performance statistics and trends.
- Experience quick and straightforward wizard-driven setup on both Linux and Windows machines, as well as easy monitoring configuration.
Cloud-based network monitoring software (SaaS) advantages

- Seamless setup – network monitoring setup on Linux and Windows takes only a matter of minutes.
- Low maintenance complexity and costs – no need for the allocation of extra hardware resources or additional software to install and maintain.
- Scalability – easily add as much infrastructure and as many components as you require, and streamline them for different tasks, departments, offices, or clients.
- Web-based UI – the monitoring application is available from any computer or tablet device anywhere around the world.
An essential monitoring collection for networks and servers

- Network devices monitoring: Ping, SNMP devices, printers.
- Network channel quality monitoring: packet loss, jitter, latency (one-way delay).
- Network interfaces monitoring: traffic, packets, errors, discards.
- A wide range of network protocols: ICMP, HTTP, TCP, SSH, FTP, SMTP, IMAP, POP3.
- Server monitoring: CPU usage, CPU load, RAM, free disk space, disk usage.
- Software monitoring: MySQL database, Apache server, log files, custom scripts, swap usage, OS processes, Windows services, Active Directory, JVM, Windows Event Logs.
Agent-based and agent-less monitoring
Anturis is a network-monitoring tool for both external (via the Anturis worldwide polling network) and internal (behind the firewall) checks within local area network (LAN) or wide area network (WAN).
Using the external checks you’ll instantly know if your internet-facing devices are experiencing connectivity issues. Anturis maintains a global monitoring network, which constantly checks that your servers and web services are up and running – and reachable for internet users.
For internal monitoring small-footprint native agents are installed on the local servers to monitor the network routes and devices. The agent maintains a secure connection with Anturis’ ISO 27001-compliant datacenter. Because the agent uses an HTTP client-side connection, no firewall configuration changes are required. The collected data can be then securely accessed from anywhere via the Anturis web console.
Infrastructure schema view with impact-dependencies modeling

You can set up an infrastructure schema view by creating meaningful and logical dependencies between network components, such as routers, printers, switches, UPSes, storages, servers, and applications.
Using impact dependencies, Anturis network monitoring tool is able to track down infrastructure components that may be causing a problem and also assess the problem’s impact on other infrastructure components. This provides the most complete picture of a problem’s cause and effect and, by helping to correctly gauge the severity of the problem, it allows for more accurate alerting of the appropriate responsible party.
Email, SMS, and voice call notifications

Minute by minute, Anturis’ back-end servers verify that everything is OK with your network and network devices. In case of a problem, an alert is sent to the designated person in charge. Various means of alert-notification can be activated, depending on the problem priority: e-mail, SMS or voice call.
Alerting can be configured according to:
- Problem/incident severity.
- Components dependencies.
- Monitor status-change rules.
- Warning and error thresholds.
- Team members’ responsibilities.

Leave a Comment