
Disk Usage Monitor
Written by Clifford
The word disk refers to any secondary storage device not directly accessible by the CPU. It uses input/output (I/O) channels to transfer necessary data to primary storage (or physical memory) that the CPU can then access directly. Accessing data on a secondary storage device is slower, but it is also less expensive and provides more storage space than physical memory.
Secondary storage is also non-volatile, meaning that data is stored even without power. The most commonly used secondary storage devices are hard disk drives and flash memory devices. For historical reasons, all secondary storage devices (and even partitions or volumes on one device), are referred to as disks, including those that do not actually have a spinning disk as their data medium.
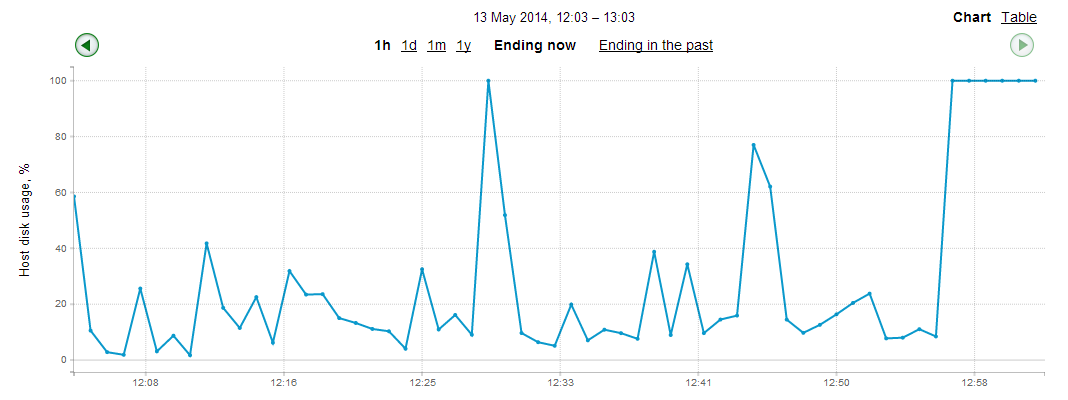
Disk usage is the percentage of time that a secondary storage device was read from or written to over a sample period of time. This gives you an idea of how busy the device is. If there are periods when no read or write operations are performed, they are referred to as idle time, and the disk usage will be below 100%. If there is no idle time (that is, data is constantly being read from or written to the disk), then disk usage over that period will be 100%.
While one request to read or write data to disk is being executed, others are placed into a queue. This queue can lead to a bottleneck. For example, when data from physical memory is waiting to be written to disk, the CPU has to wait for physical memory to free up in order to write the result of an operation to RAM, which in turn creates a queue of requests for CPU calculations. The disk I/O system is frequently the cause of such bottlenecks.
Disk usage monitoring can help you identify when the workload of the server becomes too intensive for the current disk I/O capabilities. This is a critical issue for database management systems, such as MySQL. Response times of a MySQL server can decrease greatly if disk I/O becomes a bottleneck. You have to ensure that data is distributed over multiple disks in such a way that their usage is low and can handle sudden bursts of activity. You can also configure disk striping, which divides data into blocks and automatically spreads those blocks over multiple disks.
Using the Anturis Console, you can set up monitoring of disk usage for any hardware component (e.g. a server computer) in your infrastructure by adding the Disk Usage monitor to the component.

Leave a Comment