
Nagios Alternatives: On-Premise and SaaS Tools
Written by Clifford
In this article we look at some alternatives to Nagios, grouping them into proprietary, SaaS, and open source tools. Some of these tools gather metrics and graph them and do nothing else; others also send alerts. Each of them is customizable in some way, and in looking at each one, we will identify at least one feature that makes it different from the others, without going into a full-blown product review. Below we provide definitions of proprietary, SaaS, and open source to make the distinctions clear.
While Nagios has been on the market for a long time, its free version lacks many of the features of the paid version. Some of those are key, like the capability of customizing the dashboard. Neither is it so-called “open source” software, since the source code is not freely available. What is freely available at Github are additional agents written by Nagios and its customers. The main issue, however, is that it is too large and complicated for a smaller IT shop which isn’t able to dedicate someone to work on it. It is simply more than many companies would need.
SaaS refers to software that is hosted and managed by a vendor and has a subscription-based pricing. Proprietary means that it is downloaded and installed on your own server, which can be in-house or in the cloud. Open source means that it’s free. Anyone can download the software. Open source software is written and maintained by a team of developers in a code repository like Github. Often a company will step in and provide support for open source software for a fee or fork off the open source project and add features to the product.
Open source software
Zabbix
Zabbix is one of the tools most often mentioned as an alternative to Nagios. It is free and open source. Users can pay for support and training, which is how the company generates revenue. Like many of the tools mentioned here, this one is available in several languages.
Zabbix has a lot of functionality, including data visualization with real-time graphing of performance. It works with SNMP, IPMI (a standard for CPU and firmware monitoring), JMX (monitoring framework for Java), and VMware monitoring.
Zabbix performs autodiscovery of network devices and VMware VMs. That means it’s not necessary to key those in manually. It works like an APM (application performance monitoring) tool in that it can test user transactions and response time, giving the end-user’s perspective with regard to latency. It does this by simulating mouse clicks and user-interaction with the screen.
One useful feature of email alerts is the ability to program the escalation schedule. That way, the email is sent up the chain of command until someone takes control of the issue.
Zappix has an API, making it possible to retrieve and update configuration and integrate with third-party apps. Thus a script can be written to deploy it to new servers.
The product is written in C, so it should have a low memory footprint.
Cost: free.
Netflix Vector
Netflix is the American video-streaming service and producer of films and TV. They have expanded beyond the USA to many countries around the world. Netflix is Amazon AWS’s largest, and one of its earliest, customers. Netflix gives away a lot of its software, including its performance-monitoring product called Vector. The documentation is here.
Vector graphs performance metrics gathered from this open source tool are available here: Performance Co-Pilot (PCP). The installation instructions are here.
Vector users configure which metrics they want to gather and whether they want a real-time or cumulative graph.
Cost: free.
Cacti
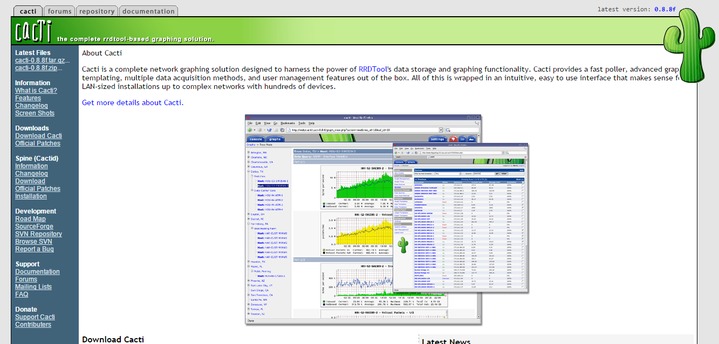
Cacti is another graphic tool. It is fairly complicated, but there is ample documentation online and a large community of followers who contribute to the forum. Since it has a wide variety of graphs, one requirement would be to learn some basics about graphing. Cacti uses SNMP as its source and relies heavily on PHP. Users would need to know something about PHP. But since PHP is not much different from other scripting languages, learning it is not difficult.
Cost: free.
Software as a service
Anturis
Anturis is an all-in-one-monitoring service for networks, servers, and websites. It can be used for both external monitoring of web services and internal monitoring of IT infrastructure components like servers and applications.
Anturis builds a model of the user’s infrastructure, using impact dependencies between its elements so as to understand which problems are related and which are in fact only parts of a single problem. For instance, if a server running Apache is down, the user will get one single notification about the failed server (the cause) and the unreachable website (the symptom).
Cost: free plan available, from $9.5 per month.
Monitis

Monitis is another cloud monitoring product. Their product includes an API with a REST interface. That means users can expose whatever data they want on the dashboard, as long as they have programmed that in their app. For example, it is possible to count how many people have signed up for a web site, which is not really a monitoring-metric, but could, nevertheless, be useful to know. For instance, if it falls off to zero, something is wrong.
Cost: from $5 per month.
Uptrends Infra
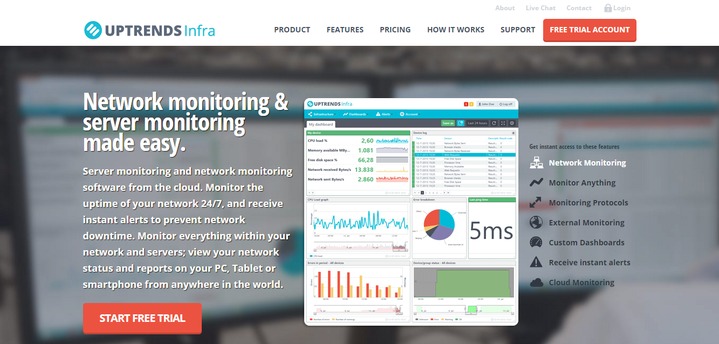
Uptrends calls its monitoring software Infra. Their cloud product monitors servers, network devices, and network protocols. Their interface is drag-and-drop, meaning tiles can be resized and moved around, as opposed to having to configure them through a settings screen. The software requires that an agent be installed to monitor servers, which makes sense, since servers do not broadcast all their metrics through any kind of standard protocol designed to do that (Syslog is not really a protocol).
Cost: from $23 per month.
Proprietary software
Paessler

Paessler calls itself “The network monitoring company.” Their product supports SNMP, WMI, Packet Sniffing, Netflow, IPFIX, jFlow, and sFlow. That means that what it does is strictly networking monitoring, i.e., users give it the address and port number of what they want to listen for. It checks those, and if that address and port stops listening, Paessler lets users know that the service behind it is down.
Cost: free plan available, from $1600.
SolarWinds
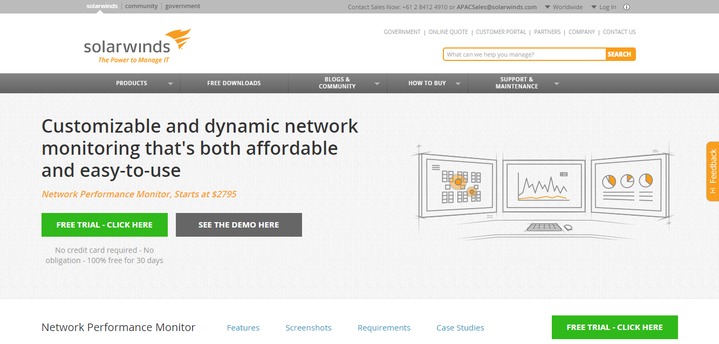
Solar Windows also calls itself network monitoring software. Like Paessler, they ping servers and ports to see if the services are listening. One interesting feature is Wi-Fi Heat Map, which lets network administrators see what parts of the building do not have an adequate signal.
Cost: from $2795.
ManageEngine
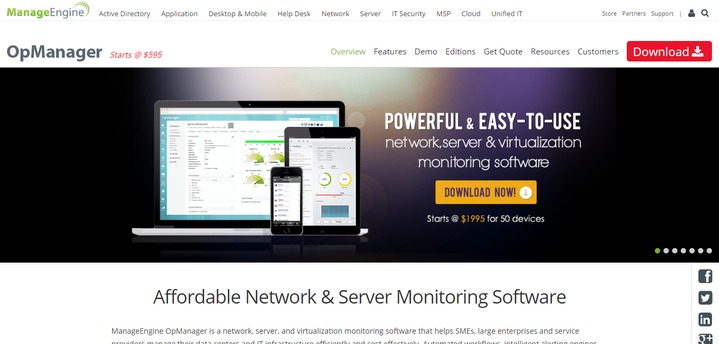
ManageEngine is one of those companies that focus on virtualization, which is obviously important for those running virtual machines in hypervisors. This alone says it’s a product designed to run in an in-house data center, since you would not have hypervisor access in most server clouds.
The product has some interesting add-ons to fit special needs, like VoIP monitoring for telephony networks and SIEM to connect to a security monitoring system to monitor for intrusion detection.
Cost: from $595.

Leave a Comment