
How to Set up CPU Temperature Monitoring for Linux Servers for Free
Written by Clifford
Devices in an infrastructure need to be kept within a normal temperature range. This is one of the key aspects of data center environmental control. If you’re running a high-end data center, you’ve probably installed all sensors necessary for temperature, humidity, power control, and so on.
However, if you’re managing something less critical, say a few racks, investing in such equipment may not seem to be worth the time and money. However, most Linux operating systems allow for quick setup of those hardware sensors’ interactors essential for CPU temperature monitoring, as well as other components and metrics.
The CPU is one of the most critical server components. It’s also one of the most vulnerable due to its propensity to overheat. In this article I’ll guide you through the process of setting up CPU temperature monitoring for Linux Servers using lm-sensors and Anturis software-as-a-service (its custom shell command monitor). As a result we’ll arrive at free continuous CPU monitoring, with a web graphical interface.
Note: in this example we’re using a specific operating system (Ubuntu) and CPU manufacturer (Intel). The steps might differ depending on your hardware and operating system settings. Also be aware that you’ll need an Anturis account to follow these steps. You can sign up for a free trial here. After your trial ends you can stay on a free plan with up to five monitors.
lm-sensors installation
lm-sensors is an open-source software that allows you to view and control sensors available on your hardware.
To install the software and detect the sensors run the below commands:
sudo apt-get install lm-sensors

sudo sensors-detect

sensors
The last command displays the values for the sensors that were previously detected:
coretemp-isa-0000
Adapter: ISA adapter
Core 0:      +53.0°C  (high = +80.0°C, crit = +100.0°C)

coretemp-isa-0001
Adapter: ISA adapter
Core 1:      +55.0°C  (high = +80.0°C, crit = +100.0°C)

coretemp-isa-0002
Adapter: ISA adapter
Core 3:      +52.0°C  (high = +80.0°C, crit = +100.0°C)

coretemp-isa-0003
Adapter: ISA adapter
Core 2:      +53.0°C  (high = +80.0°C, crit = +100.0°C)

it8718-isa-0290
Adapter: ISA adapter
in0:         +1.12 V  (min =  +0.00 V, max =  +4.08 V)
in1:         +1.89 V  (min =  +0.00 V, max =  +4.08 V)
in2:         +3.28 V  (min =  +0.00 V, max =  +4.08 V)
in3:         +3.04 V  (min =  +0.00 V, max =  +4.08 V)
in4:         +0.24 V  (min =  +0.00 V, max =  +4.08 V)
in5:         +0.02 V  (min =  +0.00 V, max =  +4.08 V)
in6:         +0.11 V  (min =  +0.00 V, max =  +4.08 V)
in7:         +3.10 V  (min =  +0.00 V, max =  +4.08 V)
Vbat:        +3.25 V
fan1:       2235 RPM  (min =    0 RPM)
fan2:          0 RPM  (min =    0 RPM)
fan3:          0 RPM  (min =    0 RPM)
fan4:          0 RPM  (min =    0 RPM)
temp1:       +51.0°C  (low  = +127.0°C, high = +127.0°C)  sensor = thermistor
temp2:       +28.0°C  (low  = +127.0°C, high = +127.0°C)  sensor = thermal diode
temp3:        -2.0°C  (low  = +127.0°C, high = +127.0°C)  sensor = thermistor
cpu0_vid:   +0.000 V
If you are not familiar with sensors, some explanation is required here:
- coretemp-isa-xxxx represents Intel Core temperature sensors.
- it8718-isa-0290 represents different sensors of a motherboard.
In this example, we see that there are at least seven temperature metrics. Temp1, temp2 and temp3 are the sensors that are placed on the motherboard. Most of the time of these monitor the CPU, while another is responsible for motherboard temperature. Unfortunately there’s no easy way to tell which monitor is for the CPU, so some guesswork is involved here. (Please, leave a comment below if there is a method for establishing which monitor is which.) Usually CPU temperature is higher than that of a motherboard. The other numbers are pretty equal compared to coretemp, so temp1 is likely to be the CPU temperature here.
But what should we monitor: temp1 or core temperatures? There is no right answer, but let’s take into consideration that motherboard sensors aren’t as accurate as core sensors, simply because they are placed on the motherboard, rather than the CPU. Thus, motherboard sensors almost always show a lower temperature. For this reason, as a rule, I prefer core sensors over the motherboard’s.
Monitoring setup
In order to start collecting data we need to create an Anturis account (sign up for a 30-day trial or create a free account), set up an agent and configure a custom shell command monitor.
After you’re done with the agent setup:
- Go to the Anturis UI;
- Select an existing component or create a new one: click ‘New component’ and select the ‘Custom’ component type;
- Click on the created component and click on the ‘Create new monitor’ button;
- Choose ‘Local resources’ > ‘Software’ > ‘Shell command’;
- Choose a monitoring agent. You’ll then see a configuration window.
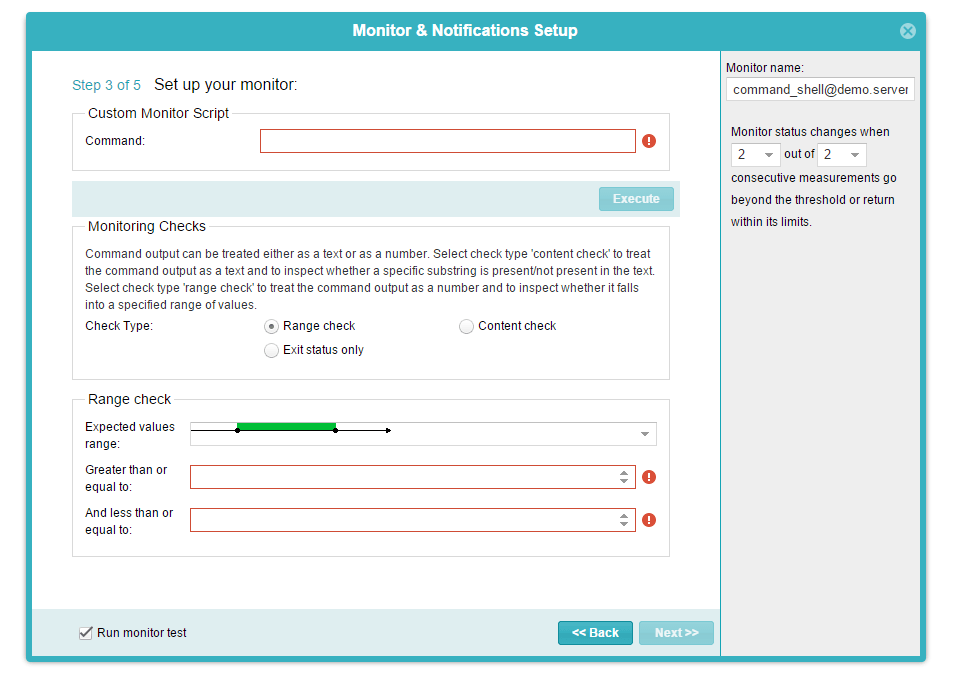
The idea behind the shell command monitor is a fairly straightforward: it executes a specified shell command and then checks if the output meets certain conditions. In our case just executing a ‘sensors’ command is not enough. We need to concatenate the strings to get only a degree (°C) as an integer. Let’s do it with the following command:
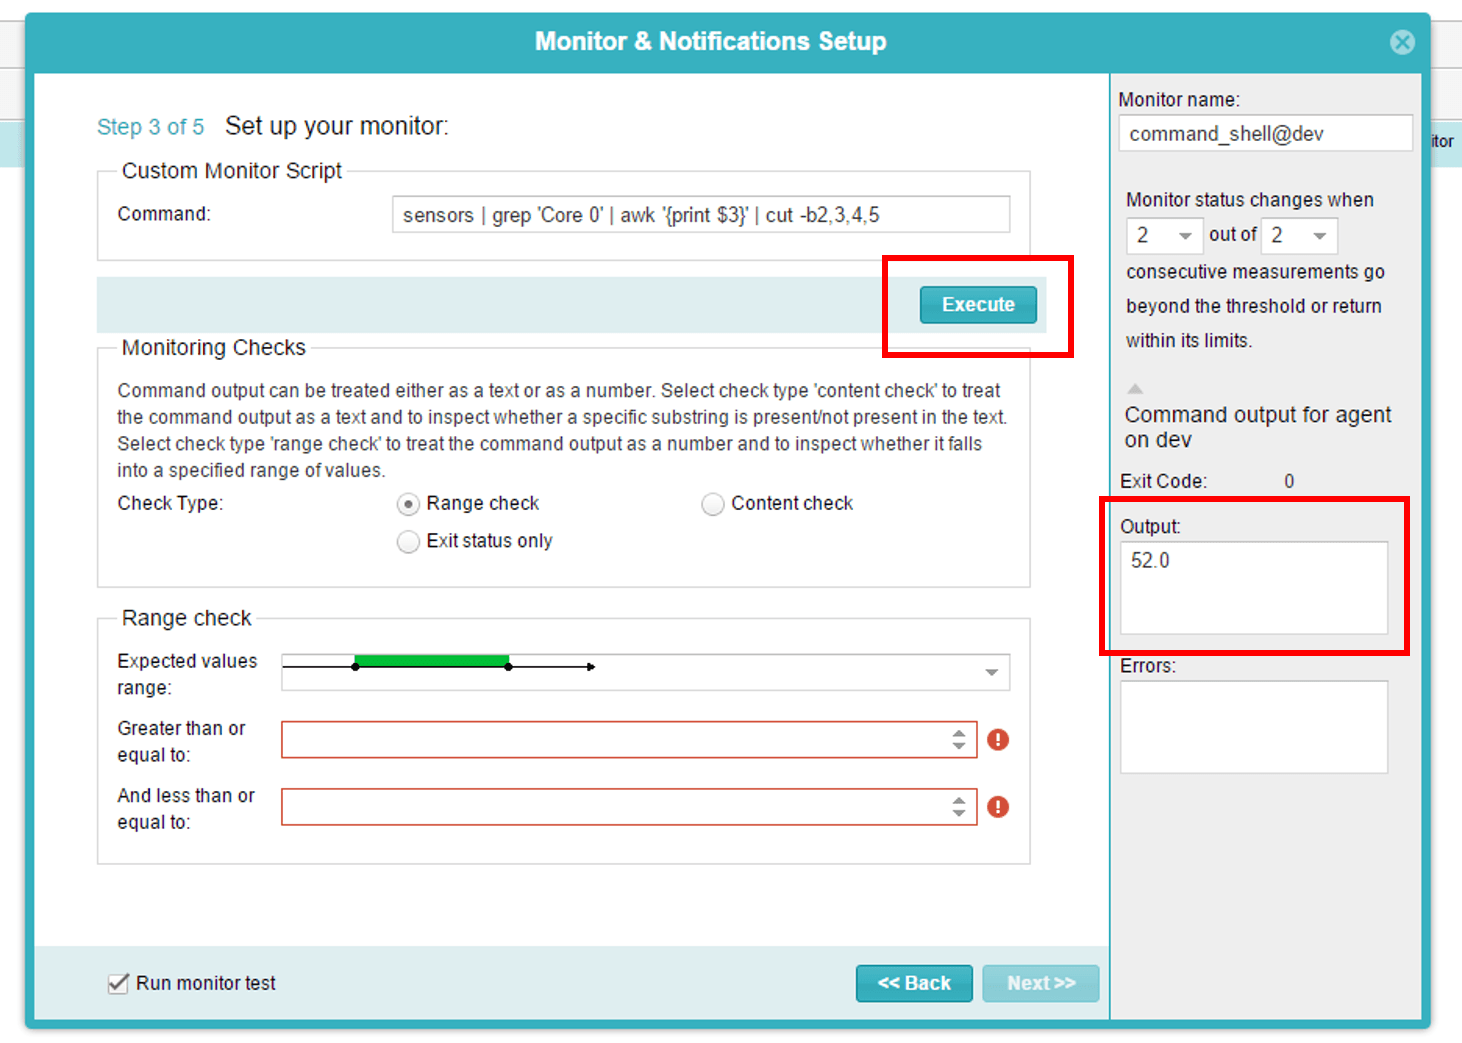
sensors | grep 'Core 0' | awk '{print $3}' | cut -b2,3,4,5You can try it right in the configuration wizard by clicking the ‘Execute’ button. In this case we get 52.0, which is right.
The last part is to set the error thresholds, that will help to identify when the core reaches the maximum operating temperature (the highest temperature at which the CPU is guaranteed to function). You can find out what this is in the technical documentation of your CPU, or just by googling it (e.g. ‘intel core 2 quad max temperature’). Our test CPU has a value of 71.4°C.
Let’s specify that in the ‘Less than or equal to’ box:

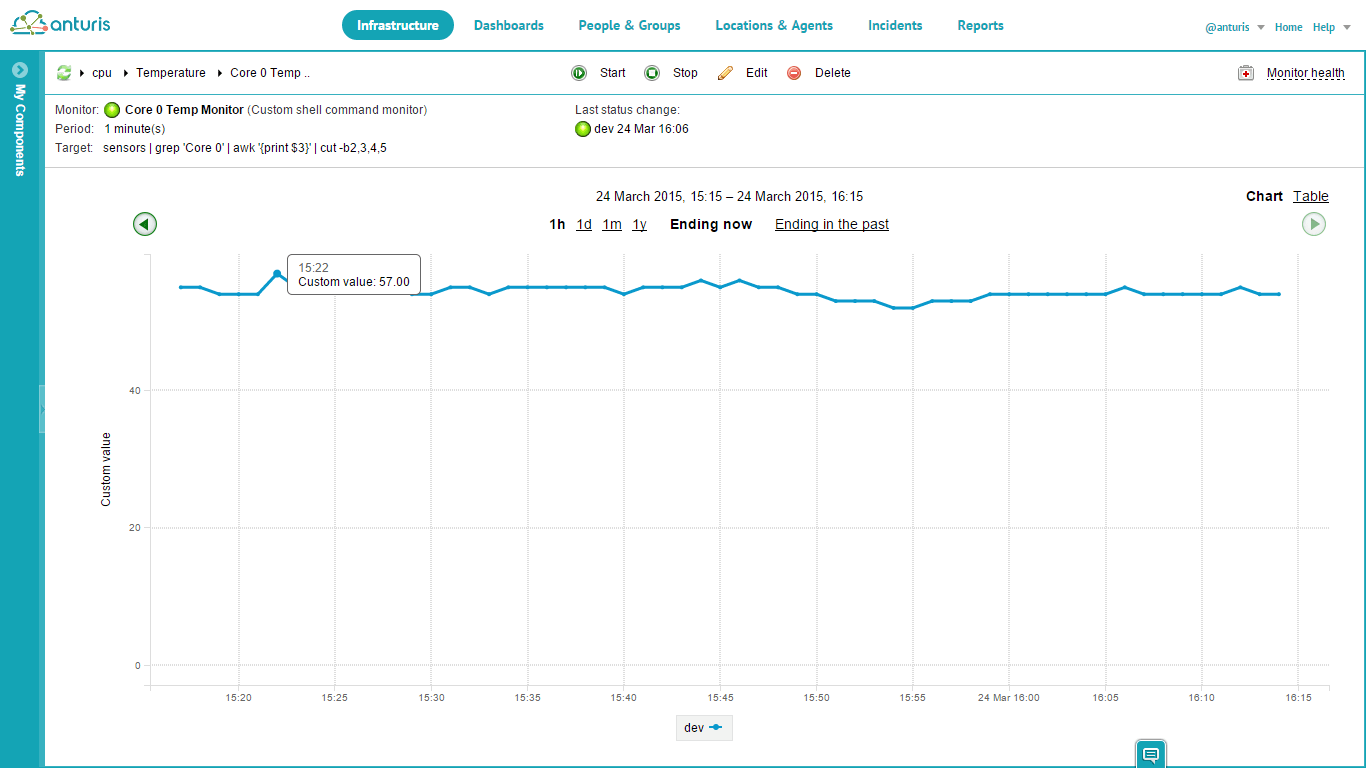
That’s it. Now you can view the collected data, get notified if the core temperature is too high, and analyze the data in your own way.
You can easily give it a try on your own by following the steps above. Please feel free to leave your comments, suggestions or questions in the comments section below.

Leave a Comment