
How to configure robust monitoring for Plesk servers in less than 5 minutes with Anturis
Written by Clifford
It is well-known that monitoring is an essential component of server management. In this article we’ll give a brief review of the few possible monitoring solutions alternatives and we’ll walk through the setup and configuration of Anturis monitoring system via the custom Plesk extension.
Plesk’s built-in monitoring functionality
Plesk’s default mode provides some basic functionality for monitoring a server. It’s represented mainly by the following tools.
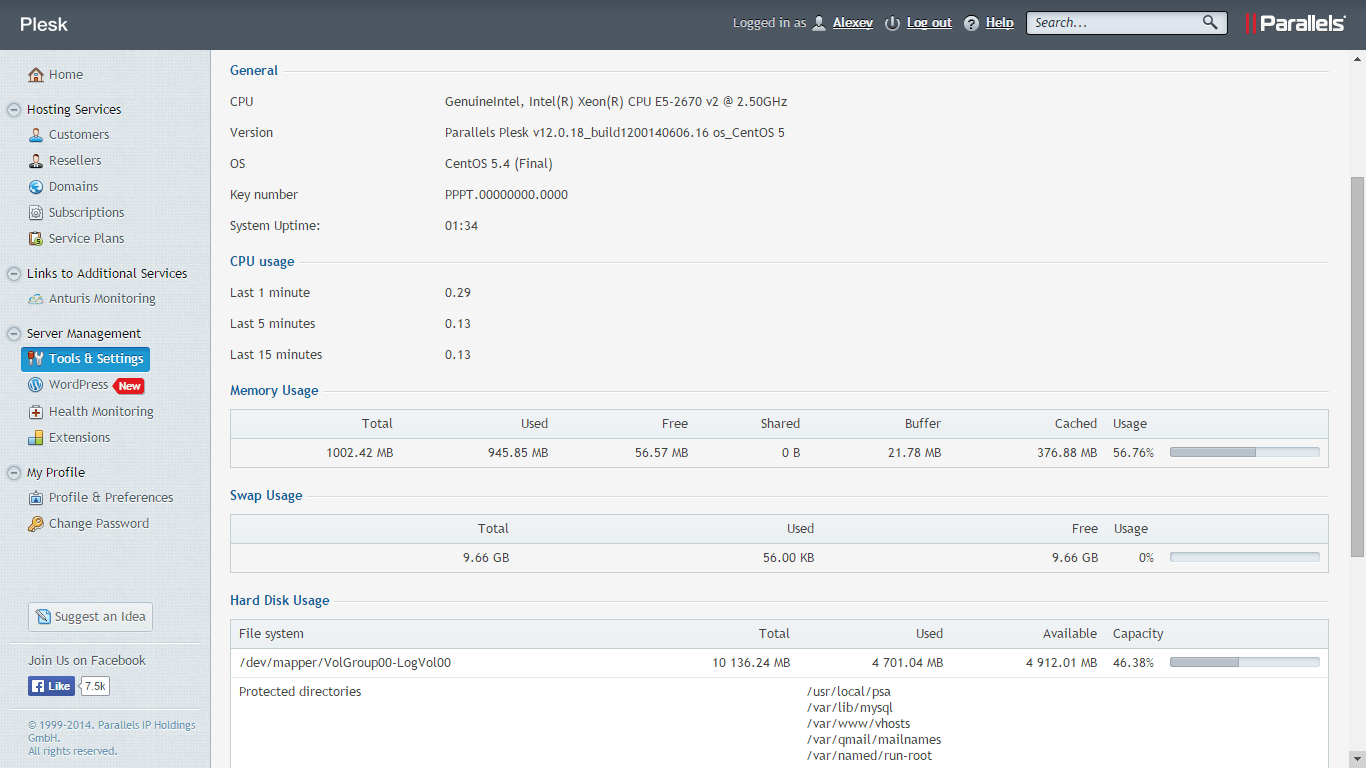
The ‘Server Information’ dashboard displays essential server resources’ metrics in real time.
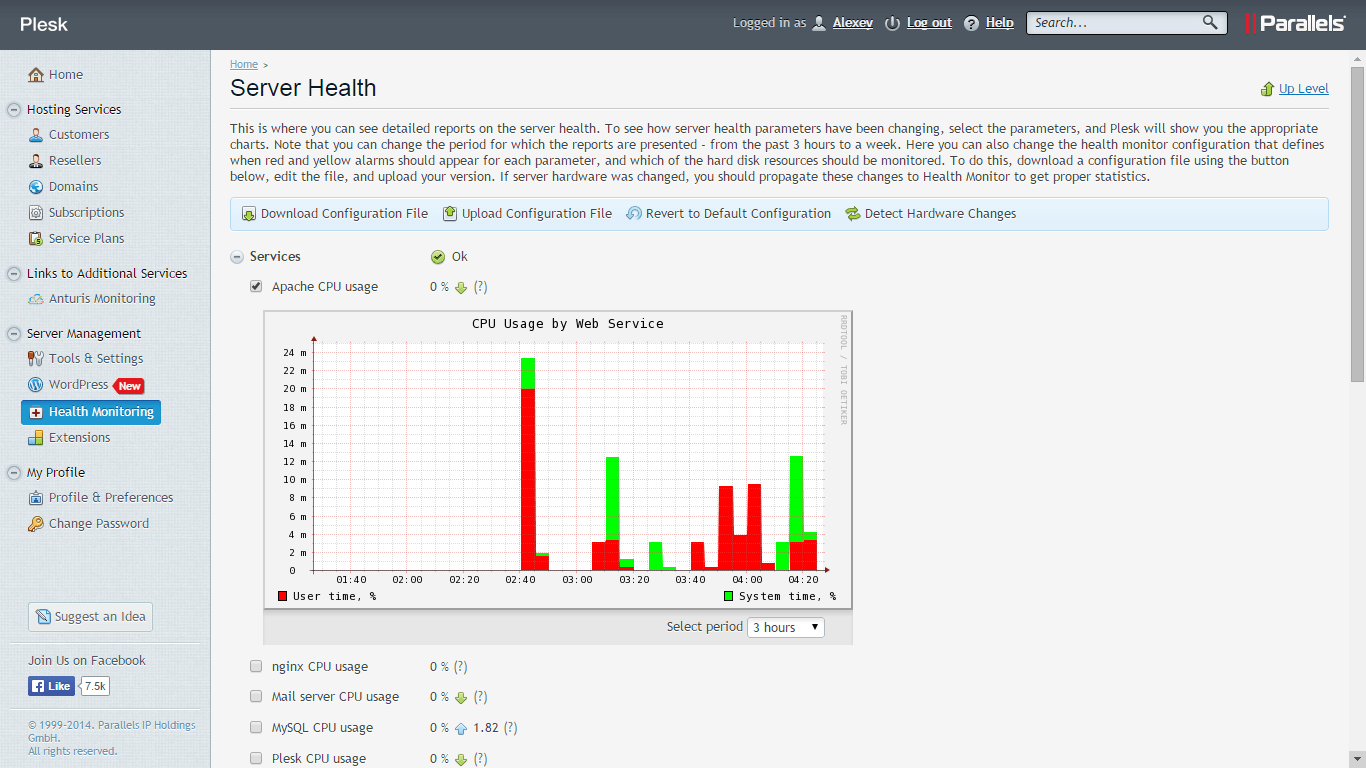
The ‘Server Health’ tool shows the health statuses of servers, along with details of the parameters of the server. You can also explore in more detail changes that the servers have undergone over anything from the last three hours to the week before.
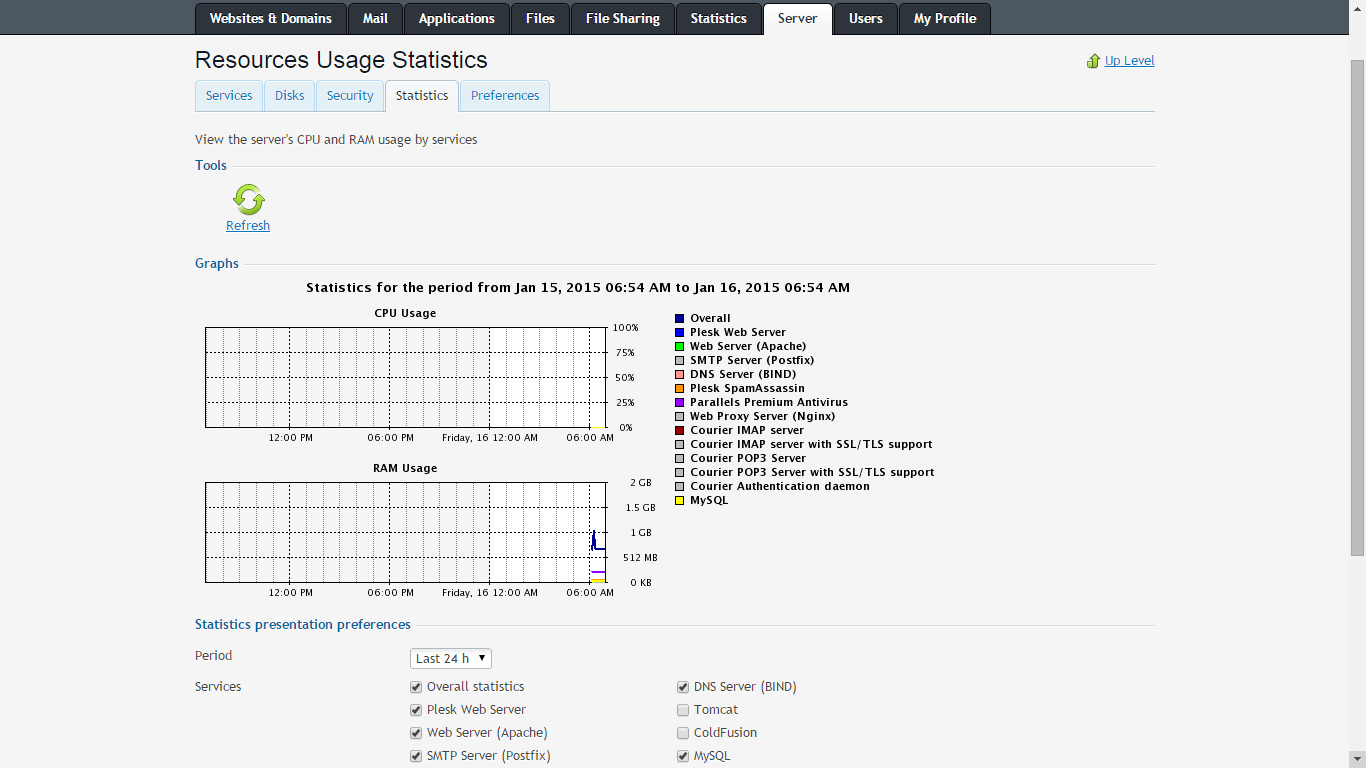
The ‘Watchdog’ extension includes security scanning, statistics on CPU and RAM usage by services, and reports that can be sent to your email on a regular basis.
Standalone monitoring solutions
Although in some cases the options above will give you the detail you’re looking for, the default mode lacks some features that more modern monitoring software provides, including for instance:
- external uptime monitoring from different geographical locations;
- customizable reports;
- a unified infrastructure view dashboard;
- notification methods rather than email (like SMS or phone calls);
- advanced alerts settings based on the severity of the problem and other factors;
- advanced external monitoring features like page load time or web transactions;
- the ability to manage multiple physical servers from one interface; and so on.
There are multiple robust server monitoring products, both on-premise and SaaS solutions, that you can use. The key problem with almost all the software is that it’s time consuming and demanding to maintain. Plesk panel users on the other hand are generally more appreciate of streamlined, straightforward solutions that don’t divert time and resources to unnecessary activities that don’t add value.
This is the prime reason why Anturis has launched its monitoring extension: to allow Plesk users to access all the advanced features of a robust software solution, all the while keeping setup and configuration easy.
The main features of Anturis’ Plesk extension are as follows.
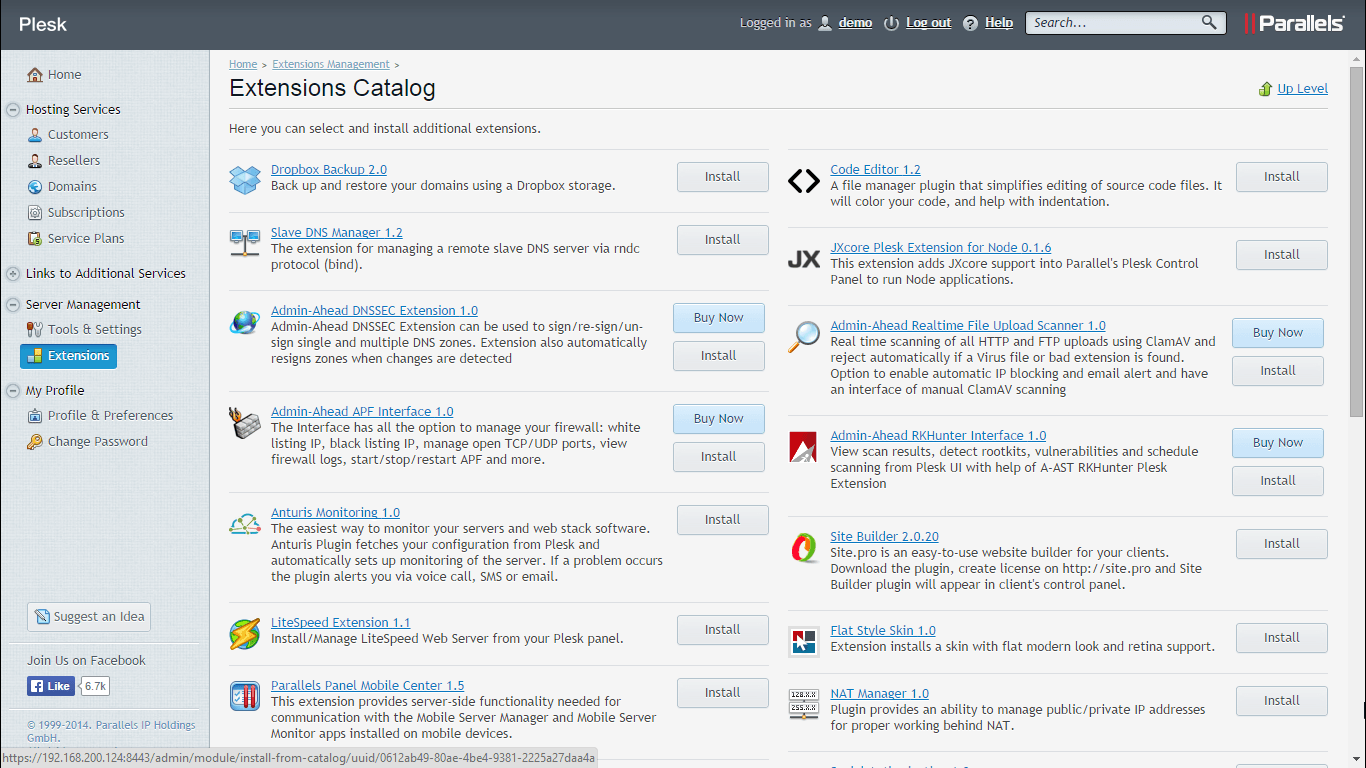
- Automatic monitoring setup and configuration with auto discovery a few clicks away, through the ‘Extensions catalogue’.
- Monitoring configuration that constantly reconfigures itself to match server configuration (and so doesn’t require manual changes).
- Even if you use multiple Plesk accounts for different servers you can manage them from one central Anturis’ account and so see the big picture of your infrastructure.
Anturis monitoring setup steps
To see how it works, let’s walk through the installation process.
If you use Plesk 12 simply go to the Extensions catalogue and click ‘install’ in the Anturis’ monitoring section.
For Plesk 11 and earlier version to install the extension you can run these commands via SSH:
wget http://anturis.com/download/anturis-plesk-plugin.tar.gz

tar xf anturis-plesk-plugin.tar.gz ; cd anturis-plesk-plugin/

./install-plesk-plugin.sh
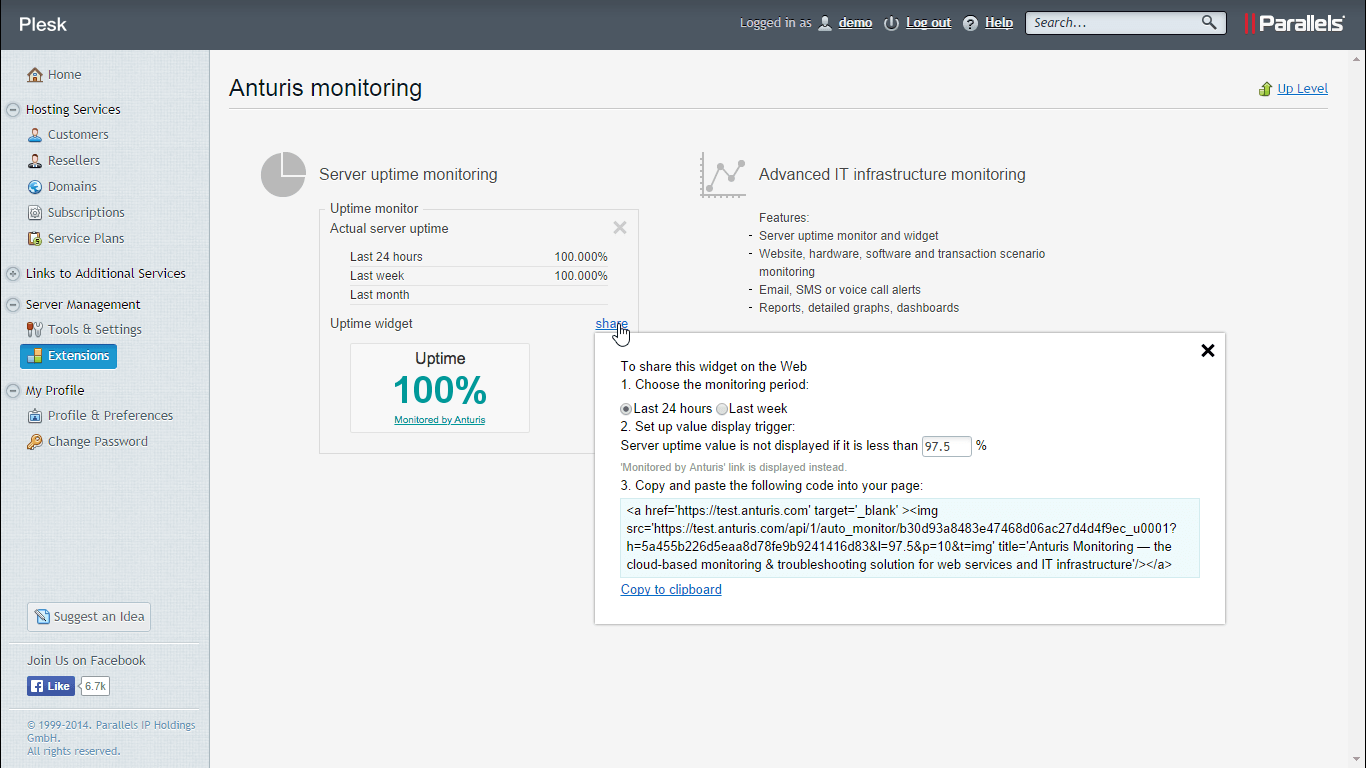
For basic monitoring, you can start with the Uptime monitor which periodically checks if servers are reachable and functioning properly. You can also share server uptime statuses on your websites via the Anturis Uptime widget, which shows the percentage of your website’s uptime. This widget is a great way to show your customers that your web service is truly reliable.
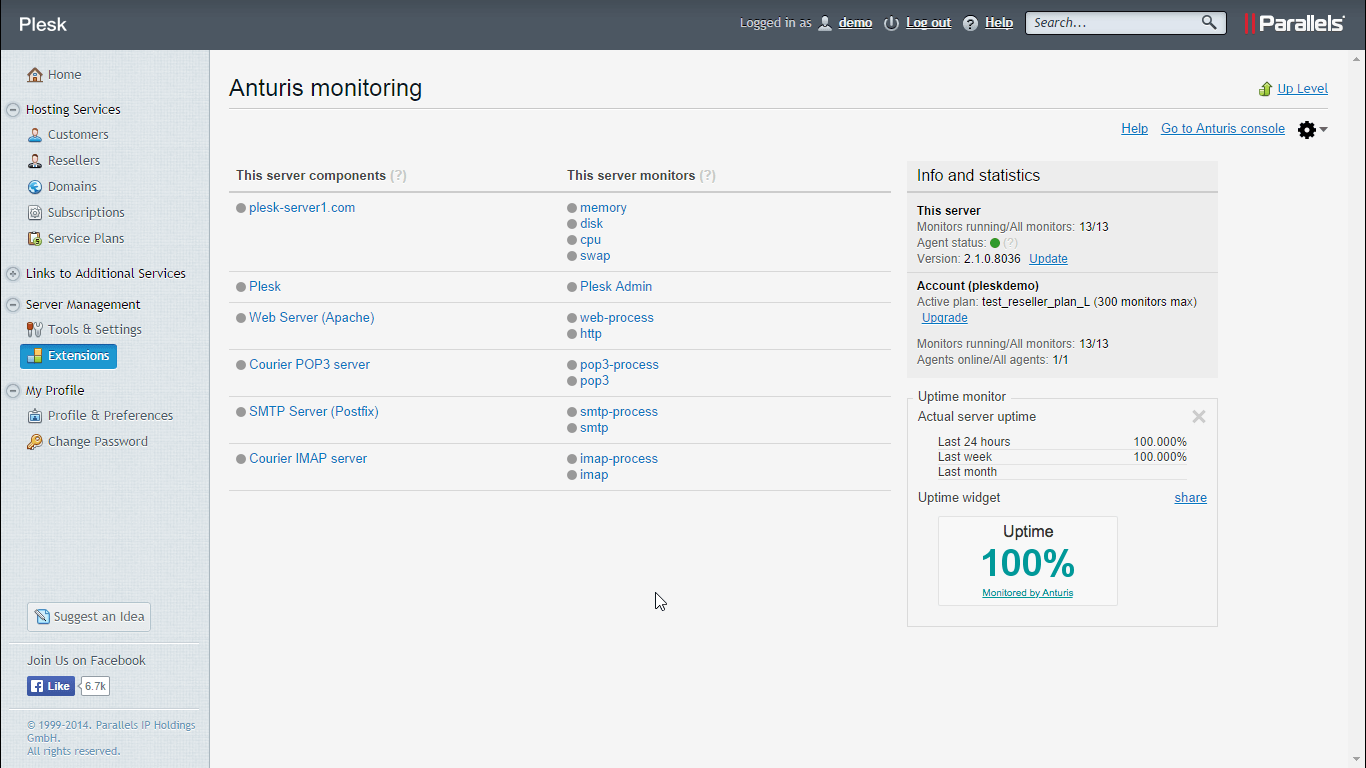
To set up monitoring of internal resources you need to create an account. The program fetches your server’s configuration and sets up monitoring of the server’s resources (Apache, FTP, Email, Plesk itself and so on).
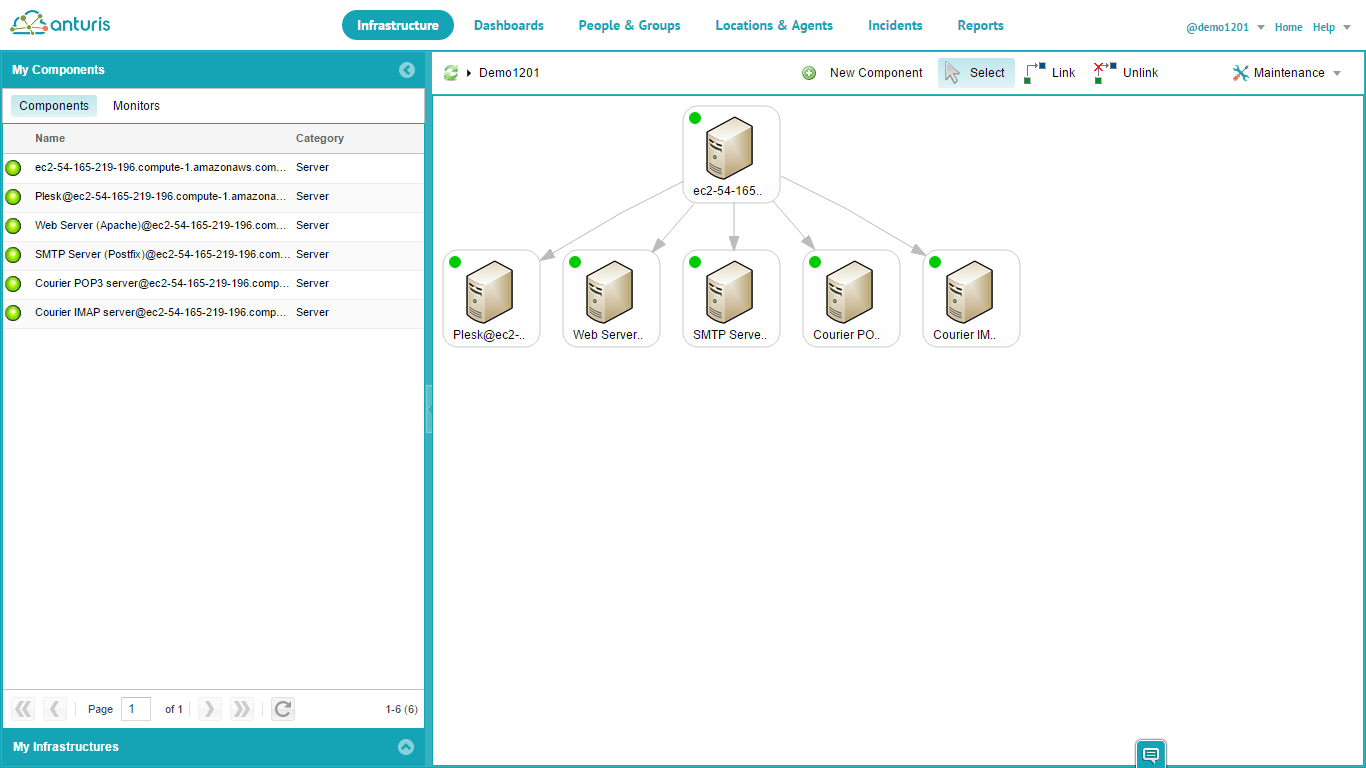
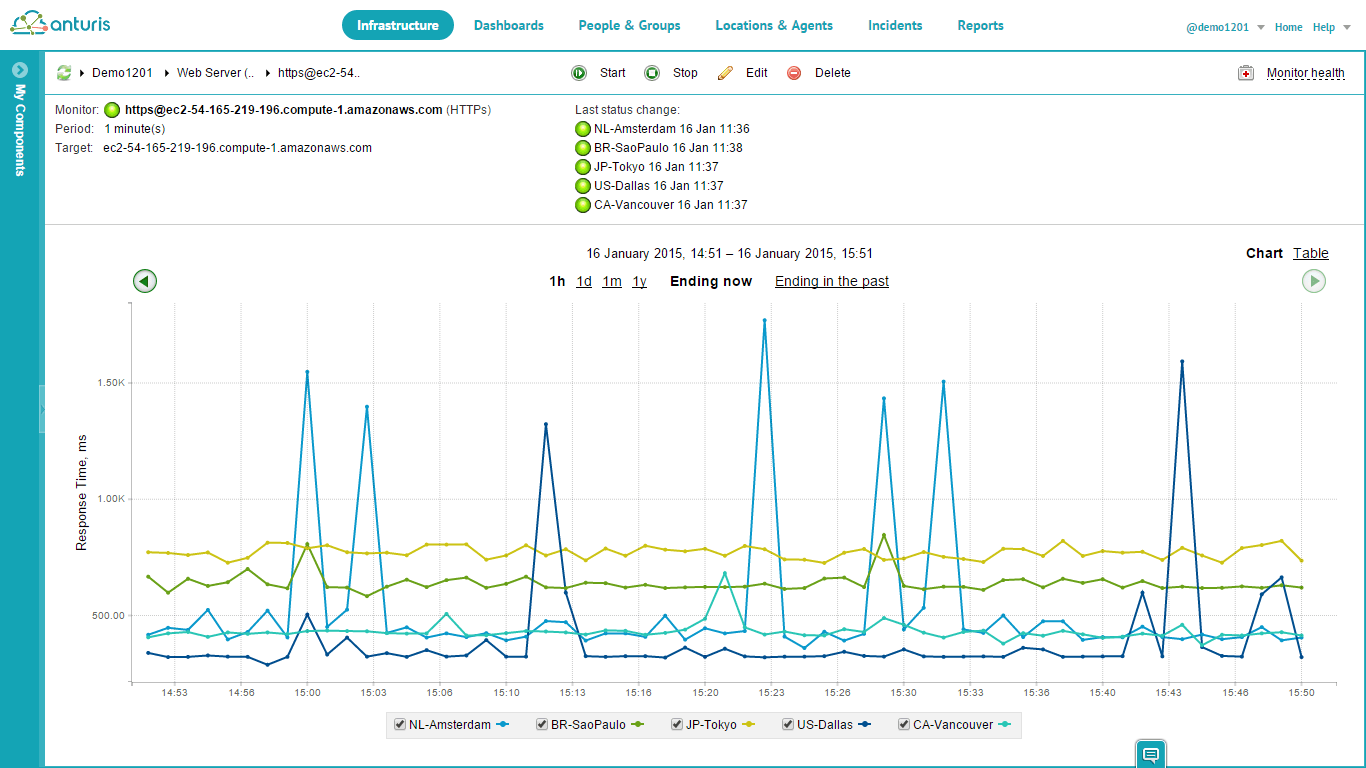
To see further details, create any other types of monitors, look at all the incidents, get reports, or to perform any other kind of activities related to monitoring and troubleshooting you can switch to the Anturis interface.
You can try Anturis for yourself: simply follow the steps in the example above. Learn more at https://anturis.com/lp/plesk/. Please share your opinion and/or experience of the extension in the comments section or by emailing Anturis’ support team at [email protected].

Leave a Comment