
End-to-end Versus Component Monitoring
Written by Clifford
W. Edwards Deming was an American statistician who was sent to Japan after World War II to help that country rebuild its manufacturing industry after the Japanese surrender. His idea was to apply monitoring, statistics, and continual improvement to business processes to improve quality. He was ignored by American manufacturers, but in Japan he became a hero as he helped the country climb out of the ashes of war.
Emperor Hirohito awarded him the Second Order Medal of the Sacred Treasure in 1960. American management eventually started paying attention to Dr. Deming when consumers quit buying poor quality American cars and bought Japanese ones instead, because Japanese cars were built better.
What Dr. Deming did was to use statistics to find and drive out variations in manufacturing processes. He mocked the notion that one should inspect every item manufactured and toss out defective products. That was the favored approach in the USA at the time. Instead, workers and management should work together to continuously improvement the manufacturing processes and reduce the number of defects by breaking down silos, working together as a team, driving out fear (let everyone speak their mind), focusing on training, and taking measurements.
Applying Dr. Deming’s Ideas to System Monitoring
Eventually people around the world adopted Dr. Deming’s ideas and gave them the names we know today: Total Quality Management (TQM), Continuous Improvement, Sigma 6, and Analytics.
What works for manufacturing, works for IT, meaning we use monitoring to find and fix flaws, adopting continuous improvement to reduce variation.
To monitor a system, one needs to agree on a common nomenclature. These we call metrics: quality of service (QoS), latency, service level, up-time, down-time, throughput, and mean-time-to failure. All of these are statistics.
So how does one put this into practice? There are two types of monitoring: end-to-end and component.
End-to-end performance monitoring measures the end-user experience. This checks whether the web page or mobile app respond is slower than normal. Properly deployed and conceived, such monitoring can head off problems before they become an issue, thus reducing calls to the helpdesk and P1 tickets – and facilitating continuous improvement.
The end-to-end system is comprised of individual components. Component monitoring means looking at each of these. For a web or mobile app this includes the application server, web server, database server, operating system, virtual machine, physical machine, storage, and networking.
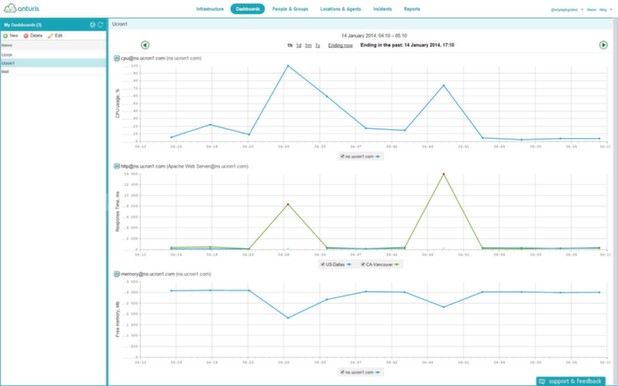
The end-to-end monitoring system monitors service availability and response latency from the perspective of the end user and the component monitoring system flags components that are performing outside norms.
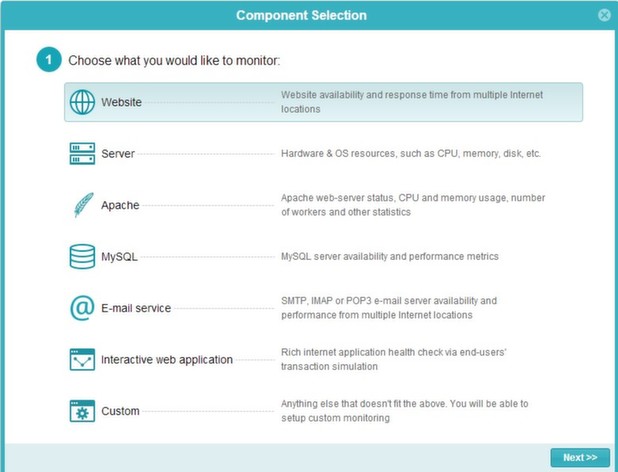
One product that does both component and end-to-end monitoring is Anturis. The product works for in-house data centers or those operating in the cloud. It works by pinging the web server for response time and mimicking a user by entering transactions to test the latency of the components that make up the application. For each server, it measures disk I/O, CPU utilization, processes and threads, memory utilization, caching, swap space, response time, and more.
The End-to-End View
The end-to-end view of the system is comprised of the web services exposed to an end-user. This may be a typical website or a more complex ‘cloud’ service. It may also be an email service, FTP server or VoIP. Depending on its nature such server speaks different protocols: HTTP, IMAP, FTP, etc.
End-to-end monitoring ensures the system is working from a user perspective. As such the monitoring tool emulates typical user scenarios and tracks how well it worked out. Example scenarios are: access to a website page, sending and receiving email, making a purchase in online shop, or logging into a customer zone. In order to emulate the last two scenarios the multi-step transaction tool is required. Multi-step transaction is essentially a process of browsing and interacting with a website by a robot that simulates visitors. This way a better verification of interactive web applications is performed.
Drill down to Component Level
The component monitoring tool allows to drill down into system components level and investigate performance issues. To provide the component view of the system, the user inputs the various components that make up the system into the infrastructure model and links them together. Depending on the component, it might be necessary to install an agent on the system to check its performance. These agents generally have a light footprint, meaning they do not impact the performance of the component they were deployed to measure. An agent is needed to monitor the OS, server resources, and local application metrics.
To define what is normal behavior, it is necessary to enter thresholds into the application. When the response time exceeds the threshold, the dashboard marks the items as red. Dr. Deming would have us set such a threshold by calculating the t-test statistic. (People today would call such an approach Analytics.) The aim is to calculate that statistic and then use it to set the threshold. This is better than setting thresholds based upon an educated guess (i.e. experience). The educated guess leads one to chase down events that are statistically insignificant.
Monitoring is also important for application tuning. For example, one can monitor number of active Apache worker threads to determine how much memory is required on a server. Monitoring database and LDAP cache utilization can help tune their configuration.
It is important to note that it is crucial to utilize both end-to-end and component level monitoring, because correlation of both views delivers invaluable support to troubleshooting. One organizational benefit of adopting the end-to-end approach to monitoring is it forces different departments — networking, database, developers, and operational support — to work together. This is what W. Edwards Deming would have wanted us to do.

Leave a Comment