
Anturis 2.2 launched – now with Full Page monitor, Maintenance mode and an improved plugin for cPanel
Written by Clifford
We’ve rolled out Anturis 2.2 – a new version of our monitoring service. The new update includes three significant new features: Full Page load monitoring, Maintenance mode, and a beta-version of Uptime monitor and widget for cPanel &WHM plugin.
So why is Anturis’ new Full Page monitor important? Nowadays, users are increasingly demanding and impatient. They don’t want to wait more than a few seconds for a page to load. Research shows that many users leave a website if it is slow and switch to a competitor’s website. Although ping, HTTP and TCP monitors are important, these monitors do not give you the whole picture of how well your website works. They do not tell you how long it takes to load a full page completely in a web browser. The Full Page monitor measures how long it takes to download a page, including all page elements – text, images, CSS, flash, etc.
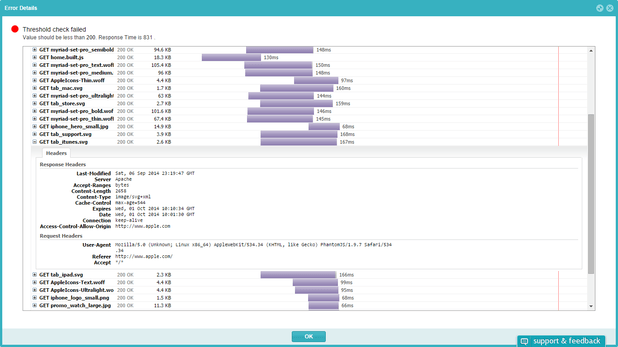
Each measurement includes a waterfall chart of page elements, showing the sequence in which elements were loaded and the time it took to load them. This allows users to identify bottlenecks that slow load times down. These may be scripts, CSS elements, large images, videos and more. Full Page monitor even has the ability to alert the website admin if page content is missing.
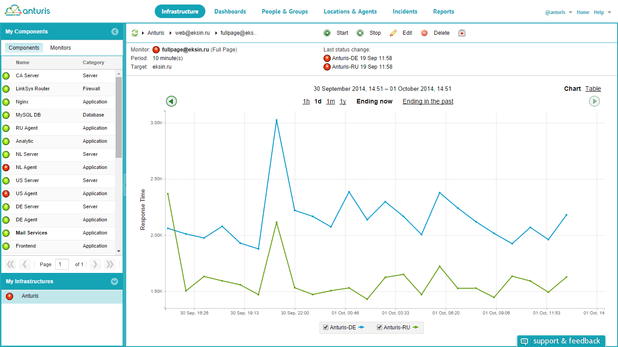
To start full page monitoring of a website, click the component in the components list on the left hand side toolbar, click New Monitor > Web-server monitors > Full Page > then follow the wizard instructions. You can use the default settings or set up your own parameters: warning and error thresholds; http or https protocols; content matching check; etc. Anturis provides alerts and notifications to enable you to take corrective steps and to improve your website’s performance.
The new version of our service offers a further important feature − Maintenance mode. Maintenance mode allows users to perform service actions on their infrastructure without affecting uptime status. When Anturis monitoring is in Maintenance mode, all problem reporting and notifications are suspended while monitoring data is collected and displayed. Maintenance mode enables you to avoid any alerts or problem reports that might occur when a monitored object, such as a server or website, is taken offline for maintenance. To switch on the Maintenance mode, click ‘Maintenance’ in the upper right hand corner of the Anturis interface window and follow the instructions.
Anturis 2.2 also includes a beta version of Uptime monitor, an Uptime widget for Anturis’ plugin for cPanel & WHM. The cPanel Uptime Monitor periodically checks if servers are reachable and functioning properly. Users can start basic monitoring of servers in cPanel & WHM − even if they don’t have an Anturis account. For more advanced monitoring features (such as transactions monitoring, email, SMS or voice call alerts, reports, detailed graphs, dashboards etc.), you can create an Anturis account easily through the cPanel interface. Users can share server uptime status on websites via the new Anturis Uptime widget, which shows website uptime percentage. This widget is a great way for businesses to show their customers that their service is reliable. The plugin can be installed in just two minutes.

Leave a Comment